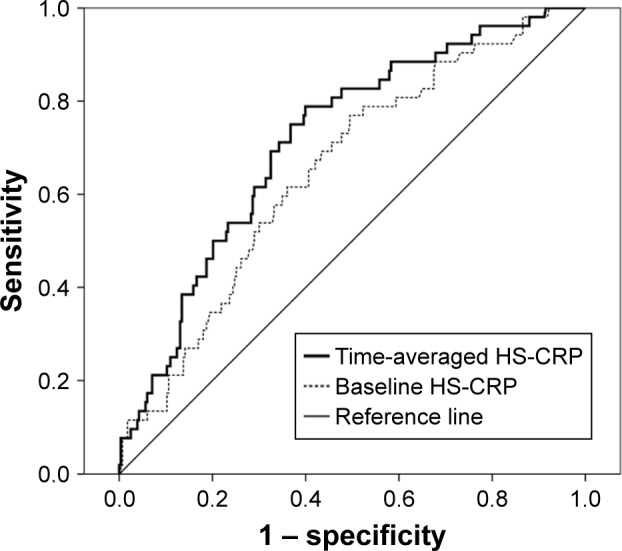
Figure 3.

ROC curve analysis for predictability of mortality between the time-averaged and baseline HS-CRP levels.
Notes: Results of the ROC curve analysis for predictability of mortality are shown. The mortality predictability of serum time-averaged HS-CRP levels appeared superior to serum baseline HS-CRP levels (AUCs: 0.717 compared with 0.653; P=0.028).
Abbreviations: HS-CRP, high-sensitivity C-reactive protein; ROC, receiver operating characteristic; AUC, areas under ROC curve.
