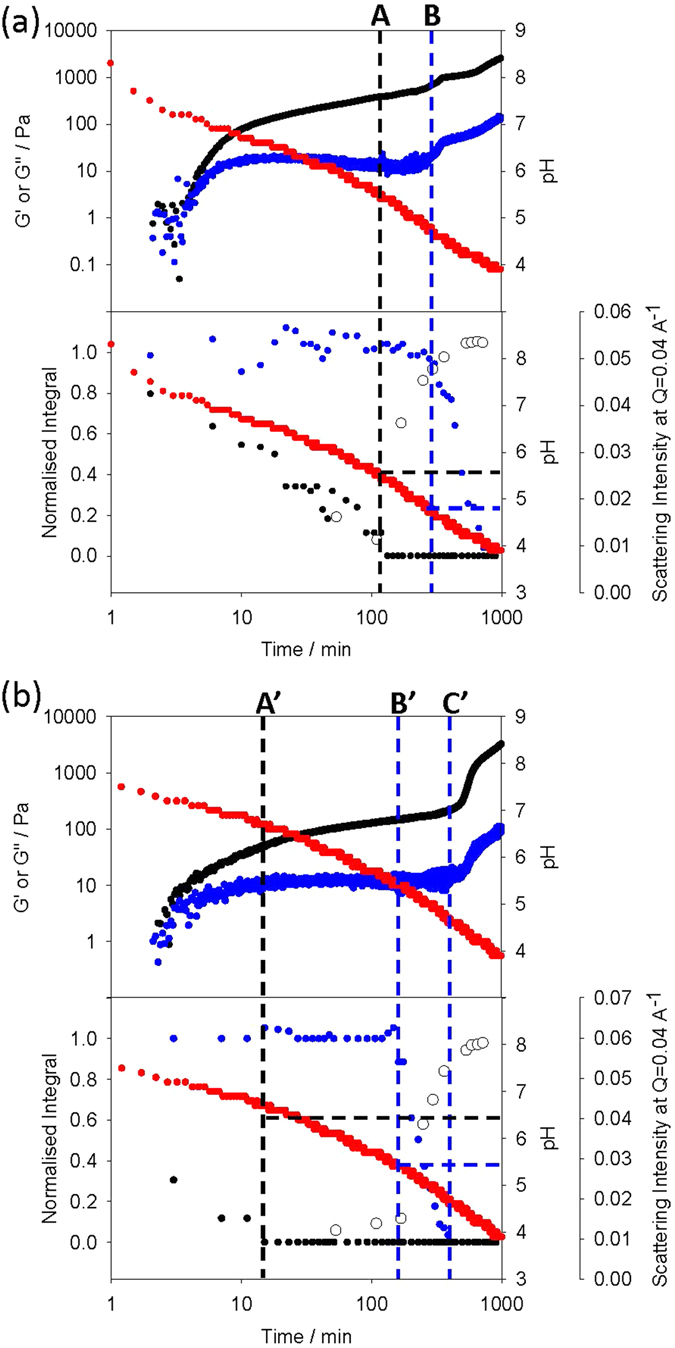
Figure 3.

Plots showing the evolution of the gel networks of the two component systems with time, monitored with different techniques: (a) 1 + 3, (b) 2 + 3. For (a) and (b), the top plots show the evolution of pH (red data) and rheological moduli (G′, black; G″, blue). The bottom plots show the evolution of pH (red data), integral of 1H NMR signals due to CH groups in 1 (black in (a)), 2 (black in (b)) and 3 (blue in (a) and (b)), and SAXS (open circles). Note that the scatter of the NMR data is attributed to the inherent inaccuracy of integrating broad NMR signals (see Fig. S3 Supporting Information). The normalised value was determined from the integration of the components against the internal standard at pD 11 before the addition of GdL.
