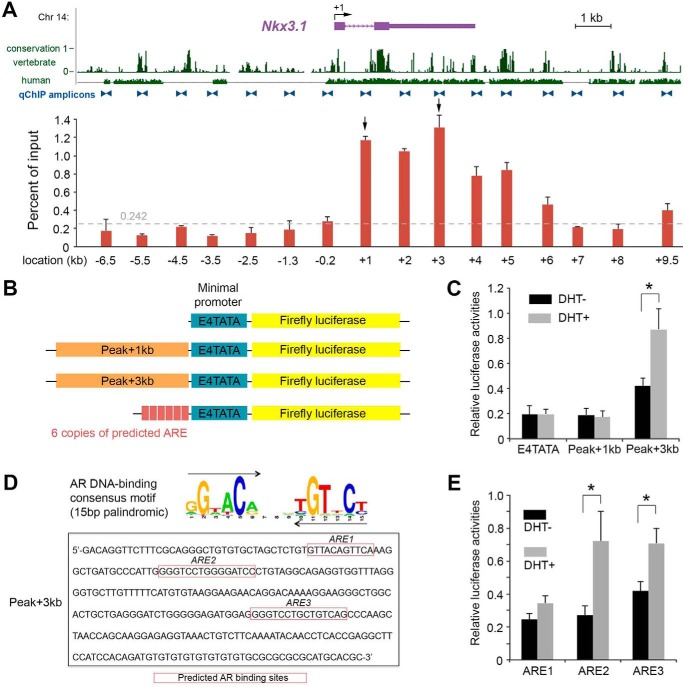
Figure 3.
AR binds to the Nkx3. 1 11-kb 3′ region to enhance its gene expression. A, distribution of AR detected by qChIP analysis over the 17-kb mouse Nkx3.1 locus in prostate chromatin. The relative enrichments are shown as the percentage of the DNA input. Locations of primer pairs for qChIP amplicons are marked by blue triangles. Conservations of DNA in vertebrate species and in human are shown as in the UCSC genome browser. Specific AR enrichments above the background noise (0.242, dashed gray line, see “Experimental procedures” for a description) were concentrated in the 11-kb region 3′ next to the TSS, with the highest two peaks at locations +3kb and +1kb, respectively (arrows). B, constructs for transient transfection and luciferase reporter assays. C, luciferase reporter assay comparing the construct with the minimal promoter with those containing Peak+1kb and Peak+3kb sequences, showing that the Peak+3kb region is androgen-responsive. D, sequences of three candidate AREs in the Peak+3kb region. E, luciferase assay comparing constructs containing six copies of each predicted ARE, showing that ARE2 and ARE3 are androgen-responsive. Error bars correspond to 1 S.D. *, p < 0.05 by Student's t test.

