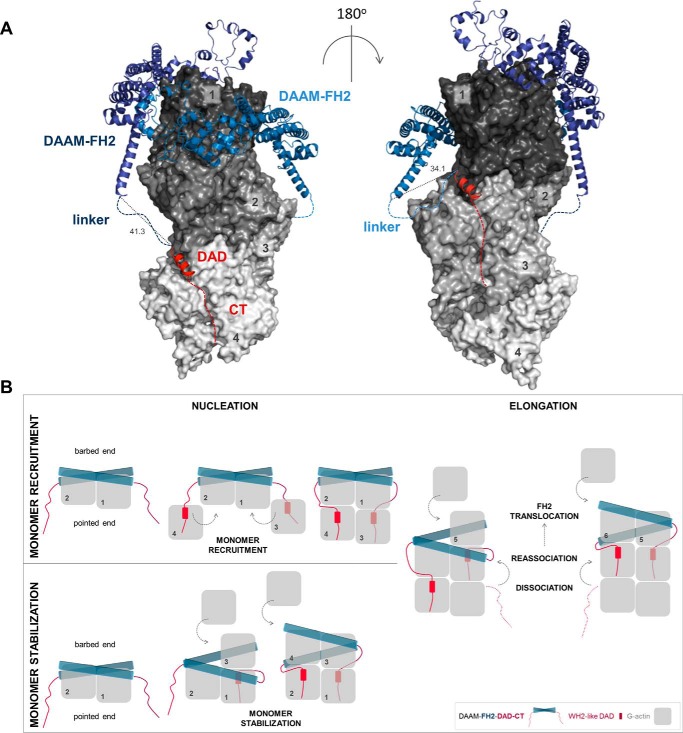
Figure 10.
Structural model of the interactions of FH2, DAD, and CT with actin. A, model was generated using X-ray structures of complexes of FH2–actin and WH2–actin. Four actin subunits (gray, indicated by numbers) are shown according to their arrangement in the Oda's model (58). The FH2 dimer of DAAM (blue) and the DAD region of mDia1 (red) are represented as ribbons. Red dashed lines indicate the possible orientation of the disordered CTs of DAAM. Blue dashed lines indicate the ∼20-aa linkers connecting the FH2 and DAD of DAAM. Distances are given in Å. The model was generated with PyMOL based on the alignment of following structures: Protein Data Bank codes: 4EAH ((48) FMNLFH2-TMR-actin); 2Z6E ((59) hDAAM-FH2); 2BAP ((60) mDia1-DAD); and 2A41 ((61) WIP-WH2). B, alternative model describing actin nucleation mediated by FH2-DAD-CT for low-affinity C-terminal formin regions. In this scenario, the binding of DAD-CT to actin requires increased affinity, which may be manifested through monomer capturing by FH2.

