Figure 5.
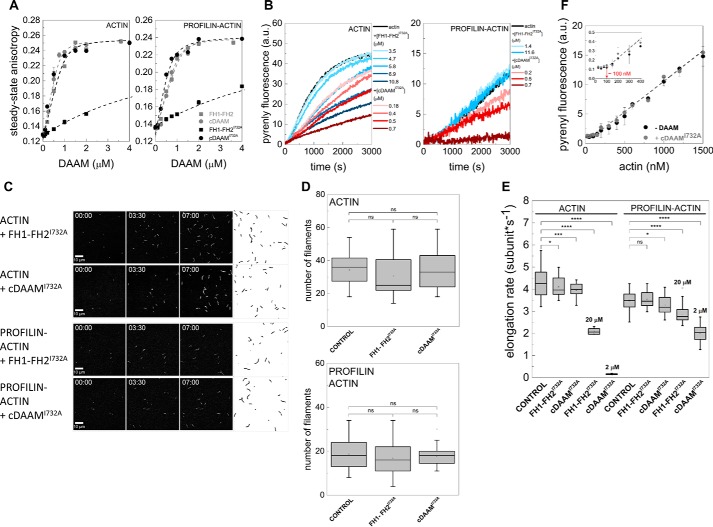
Effects of DAAM DAD and CT regions on the loss-of-function mutation of FH2. A, steady-state anisotropy of Alexa488NHS-labeled G-actin in the absence and presence of profilin as the function of DAAM concentration, as indicated. The data for FH1–FH2 and cDAAM from Fig. 2C are shown here as controls. Dashed lines in the corresponding colors show the fits to the data according to Equation 3. Dissociation equilibrium constants are summarized in Table 1. Error bars, standard deviations, n = 2–3. Final concentrations are as follows: [actin] = 0.2 μm; [LatA] = 4 μm; [profilin] = 0.8 μm; [NaCl] = 5 mm. B, representative polymerization kinetics of free G-actin and profilin/G-actin in the absence and presence of different regions of DAAM, as indicated. Final concentrations are as follows: [actin] = 2 μm; [profilin] = 6 μm. C, TIRFM montages of actin assembly and representative skeletonized images showing the field of view of actin assembly in the absence and presence of FH1–FH2I732A and cDAAMI732A, as indicated (for spontaneous actin assembly see Fig. 2D). Scale bar, 10 μm, time = min/s. Final concentrations are as follows: [actin] = 0.5 μm; [profilin] = 2 μm; [FH1–FH2I732A] = 100 nm; [cDAAMI732A] = 100 nm. D, number of actin filaments nucleated spontaneously or in the presence of FH1–FH2I732A and cDAAMI732A derived from skeletonized images. Final concentrations as in C, n = 20–50. E, elongation rate of individual actin filaments polymerized from free and profilin/G-actin in the absence and presence of FH1–FH2I732A and cDAAMI732A. Final concentrations as in C. 20 and 2 μm indicate the data obtained in the presence of higher concentrations of FH1–FH2I732A and cDAAMI732A, respectively, n = 15–79. F, critical concentration (J(c)) plots of actin assembly in the absence and presence of cDAAMI732A (1 μm), as indicated. Inset, enlarged view of the initial part of the J(c) plot, red arrow highlights the breaking points corresponding to the unassembled actin at steady-state. Dashed lines in the corresponding colors show the fit to the linear part of the data. Error bars, standard deviations, n = 3. a.u., arbitrary units; ns, not significant.

