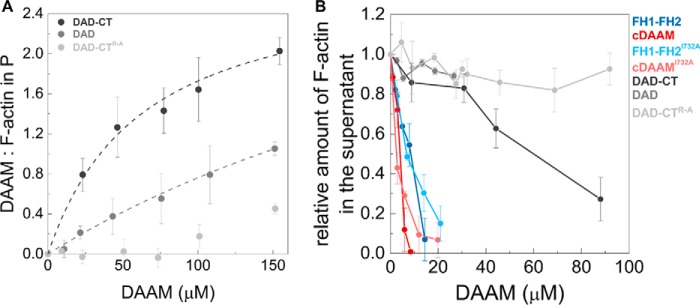
Figure 7.
Interaction of DAD-CT with actin filaments. A, DAAM/F-actin ratio in the pellet (P) derived from the analysis of SDS-polyacrylamide gels. Dashed lines correspond to the fit of the data (21, 35); the fit gave KD values of KD(DAD-CT) = 38.9 ± 3.2 μm, KD(DAD) > 100 μm. [F-actin] = 2.5 μm. Error bars, standard deviations, n = 2–4. B, bundling activity of different regions of DAAM. The relative amount of actin filaments in the supernatant as the function of DAAM concentration, determined from the quantification of SDS-PAGE analysis of the samples. Final concentrations are as follows: [F-actin] = 1 μm. Error bars, standard deviations, n = 2–3.

