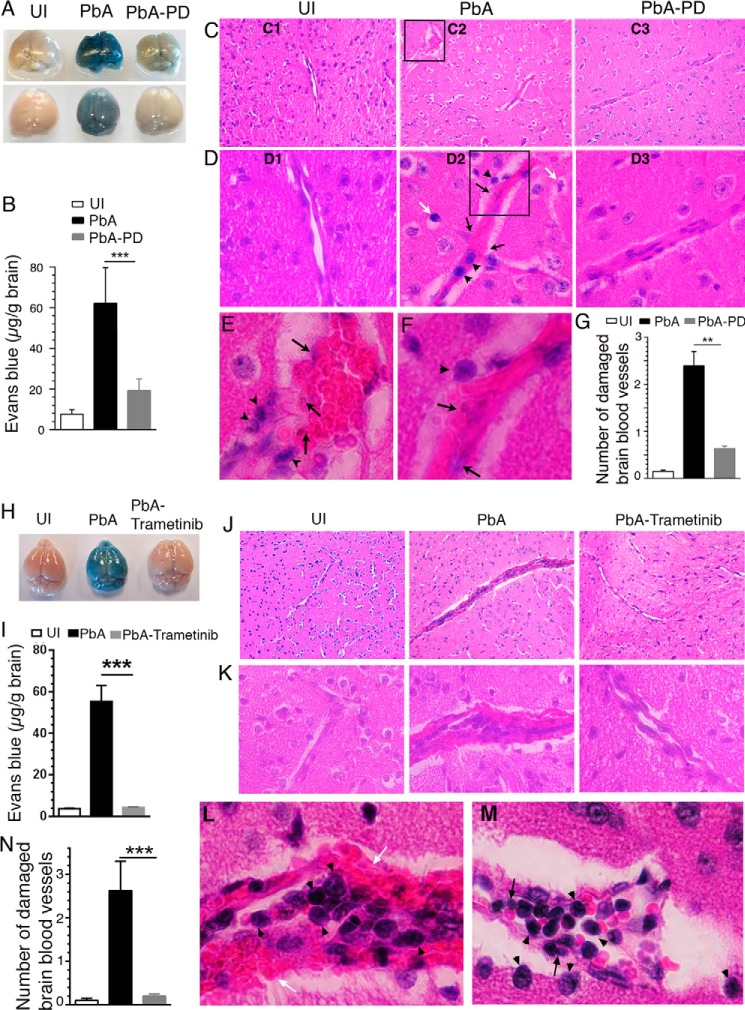
Figure 3.
MEK1/2 inhibitor treatment blocks BBB damage and ECM pathology. PbA-infected mice were treated i.p. with 3 mg of PD/kg body weight or vehicle daily starting at 6 h pi. In separate experiments, PbA-infected mice were treated orally with either vehicle or 5 mg of trametinib/kg body weight daily starting at 6 h pi. A and H, photographs of the brains of two groups of mice in the PD treatment experiment (A, n = 7 mice/group) and one group of mice in the trametinib treatment experiment (H, n = 6 mice/group). B and I, amount of Evans blue leaked into the brain tissues of mice in the PD treatment experiment (B, n = 7 mice/group) and trametinib treatment experiment (I, n = 6 mice/group). C–F, images of H&E-stained brain sections of a representative group in the PD treatment experiment. C, ×10 images (C1–C3); D, ×40 images (D1–D3) corresponding to the middle portion of ×10 images (C1–C3); E, ×100 image of the boxed area in C2; F, ×100 image of the boxed area in D2. D2, E, and F, endothelial damage, sequestered parasites (black arrows), infiltrated lymphocytes (arrowheads), and condensed neuronal cells (white arrows) in the brains of PbA mice are indicated. These features were either negligible or absent in the brains of uninfected (D1) and PbA-PD (D3) mice. J–M, ×10 (J), ×40 (K), and ×100 (L and M) images of H&E-stained brain sections of a representative group in trametinib treatment experiment. Sequestered parasites (black arrows), infiltrated lymphocytes (arrowheads), and damaged BBB (white arrows) are shown in L and M. G and N, numbers of damaged blood vessels in 20 randomly selected fields in the H&E-stained tissue sections of the PD-treated (G) and trametinib-treated groups (N) were counted and plotted; n = 4 mice/group). Statistical analysis was by one-way ANOVA with Newman–Keuls correction for multiple comparisons. Error bars, S.D. (I and B) and S.E. (G and N). **, p < 0.01; ***, p < 0.001.

