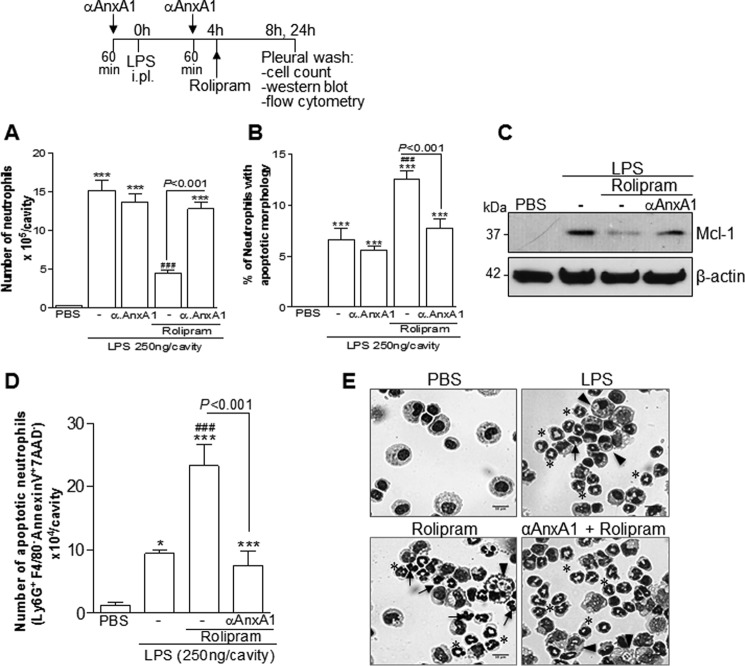
Figure 6.
Effect of treatment with anti-AnxA1 antiserum on ROL-induced resolution of acute inflammation. Mice were injected with LPS (250 ng/cavity, i.pl.) or PBS and 4 h later received an injection of ROL (6 mg/kg, i.p.). Injections of anti-AnxA1 antiserum (αAnxA1, 200 μl, i.p.) were given 1 h before the challenge with LPS and again 1 h before ROL. Numbers of neutrophils (A), cells with distinctive apoptotic morphology (B), and Western blotting for Mcl-1 (C) were evaluated 4 h after drug treatment (i.e. 8 h after LPS challenge). The number of annexin V+ neutrophils (D) was evaluated by flow cytometry 24 h after LPS injection. Representative figures of nonapoptotic (asterisk) and apoptotic cells (arrows) and apoptotic cells inside macrophages (arrowheads) are shown in E (original magnifications, ×20). Results are expressed as the number of neutrophils/cavity (A), percentage of neutrophils with apoptotic morphology (C), and apoptotic neutrophils (Ly6G+/F4/80−/AnxAV+/7AAD− (D) and are shown as the mean ± S.E. (error bars) of at least five mice in each group. *, p < 0.05; ***, p < 0.001 when compared with PBS-injected mice. ###, p < 0.001 when compared with LPS-challenged mice. Comparisons between the groups ROL and ROL + αAnxA1 are highlighted in the graphics. For loading control, membranes were reprobed with anti-β-actin. Blots are representative of three independent experiments using pooled cells from at least five animals in each experiment.

