Figure 1.
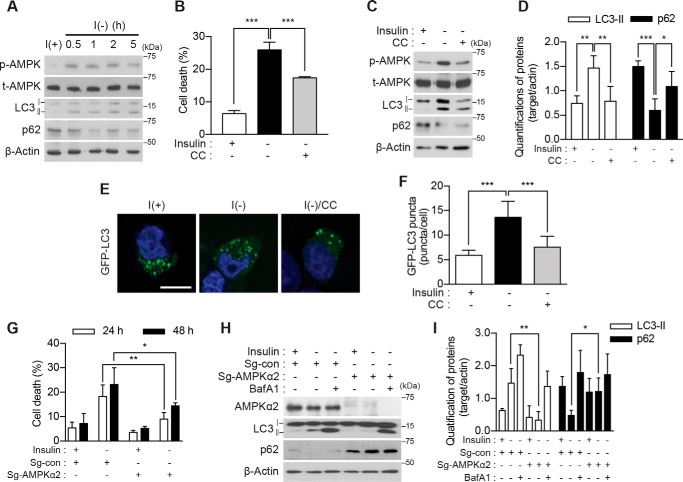
AMPK activation is required for ACD in I(−) HCN cells. A, time-course analysis of AMPK activation and autophagy induction following insulin withdrawal. Blots shown are representative of three independent experiments, which yielded similar results. B, pharmacological inhibition of AMPK with CC (0.5 μm) decreased cell death (n = 5). C, administration of CC attenuated autophagy. The levels of LC3-II and p62 were measured 5 h after insulin withdrawal. D, quantification of LC3-II and p62 after normalization to β-actin (n = 5). E, HCN cells were transfected with the GFP-LC3 plasmid, and LC3 puncta were visualized after insulin withdrawal for 5 h. F, analysis of E. Quantification of the puncta from three independent experiments (n = 40) is shown. G, AMPK α2 knock-out decreased cell death following insulin withdrawal. Cell death of AMPK α2 KO (Sg-AMPK α2) and control (Sg-con) HCN cells was measured at the indicated time points following insulin withdrawal (n = 4). H, autophagy flux following insulin withdrawal (5 h) was abrogated in AMPK α2 KO HCN cells. BafA1 (20 nm) was added 1 h before sampling. I, quantification of LC3-II and p62 after normalization to β-actin (n = 4). Error bars represent ±S.D. from independent assays. *, p < 0.05; **, p < 0.01; ***, p < 0.001. Scale bar, 10 μm. p-AMPK, phospho-AMPK; t-AMPK, total AMPK.

