Figure 6.
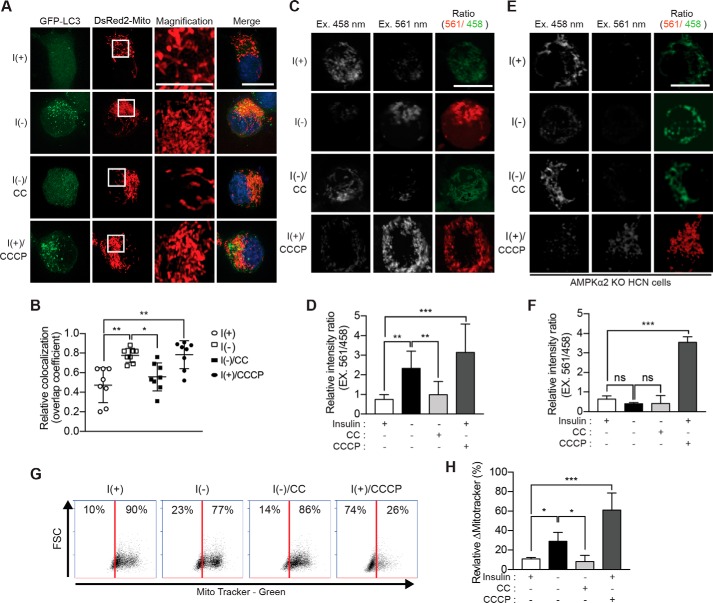
AMPK induces mitophagy in I(−) HCN cells. A, transfection of HCN cells with the plasmids encoding GFP-LC3 and DsRed2-Mito. Mitophagy was assessed as the overlap of LC3 and DsRed2-Mito signals and was greatly enhanced following insulin withdrawal (5 h) and prevented by CC. Inset, a high-magnification image of the boxed area. B, analysis of A. Quantification of mitochondrial localization of GFP-LC3 (n = 8) is shown. C, fluorescence signal of mt-mKeima. Cells expressing mt-mKeima were excited (Ex.) at two wavelengths (458 and 561 nm), and the emission signal was collected at 620 nm after insulin withdrawal for 5 h. D, analysis of C. The relative intensity ratio as an index of mitophagy (n = 10) is shown. E, insulin withdrawal-induced mitophagy was abrogated in AMPK α2 KO HCN cells. F, analysis of E. The relative intensity ratio as an index of mitophagy is shown. CCCP (5 μm for 5 h) was added to I(+) HCN cells to induce mitophagy as a positive control (n = 8). ns, not significant; G, the amount of mitochondria in HCN cells following insulin withdrawal for 12 h and treatment with CC (5 μm for 12 h) was determined by FACS using MitoTracker Green (x axis). FSC, forward scatter. H, analysis of G. The relative ΔMitoTracker (%) as an index of mitophagic degradation of mitochondria is shown. CCCP (10 μm for 12 h) was used as a positive control (n = 5). Error bars represent ±S.D. from independent assays. *, p < 0.05; **, p < 0.01; ***, p < 0.001; ns, not significant. Scale bar, 10 μm.

