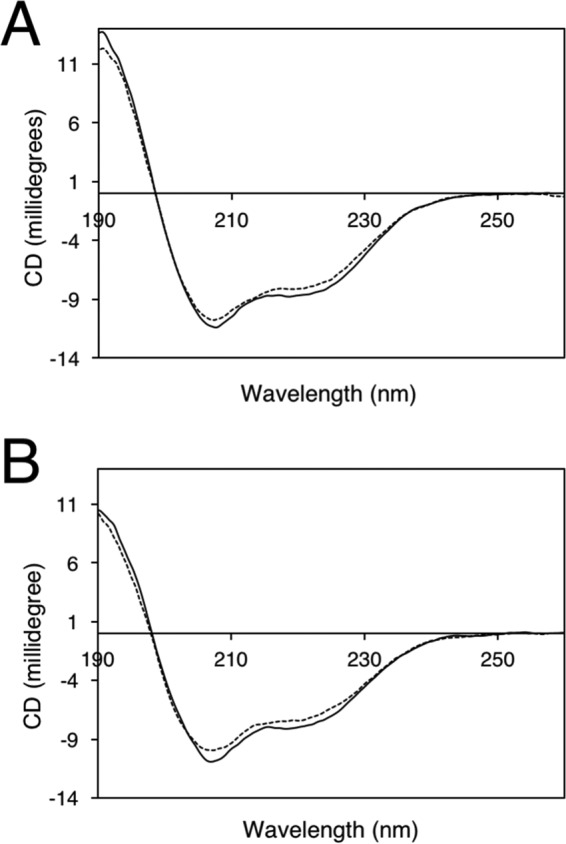
Figure 2.

Light-induced structural changes of phot1 A'α-LOV2-Jα measured by far UV circular dichroism spectroscopy (190–260 nm). A, CD spectra of phot1 A'α-LOV2-Jα in the dark (solid line) or after irradiation with blue light (dashed line). B, CD spectra of phot1 A'α-LOV2-Jα carrying the R472H mutation in the dark (solid line) and after blue light treatment (dashed line). Data shown for each protein represent the average of two scans, collected at a scan rate of 50 nm min−1 using a bandwidth of 1 nm.
