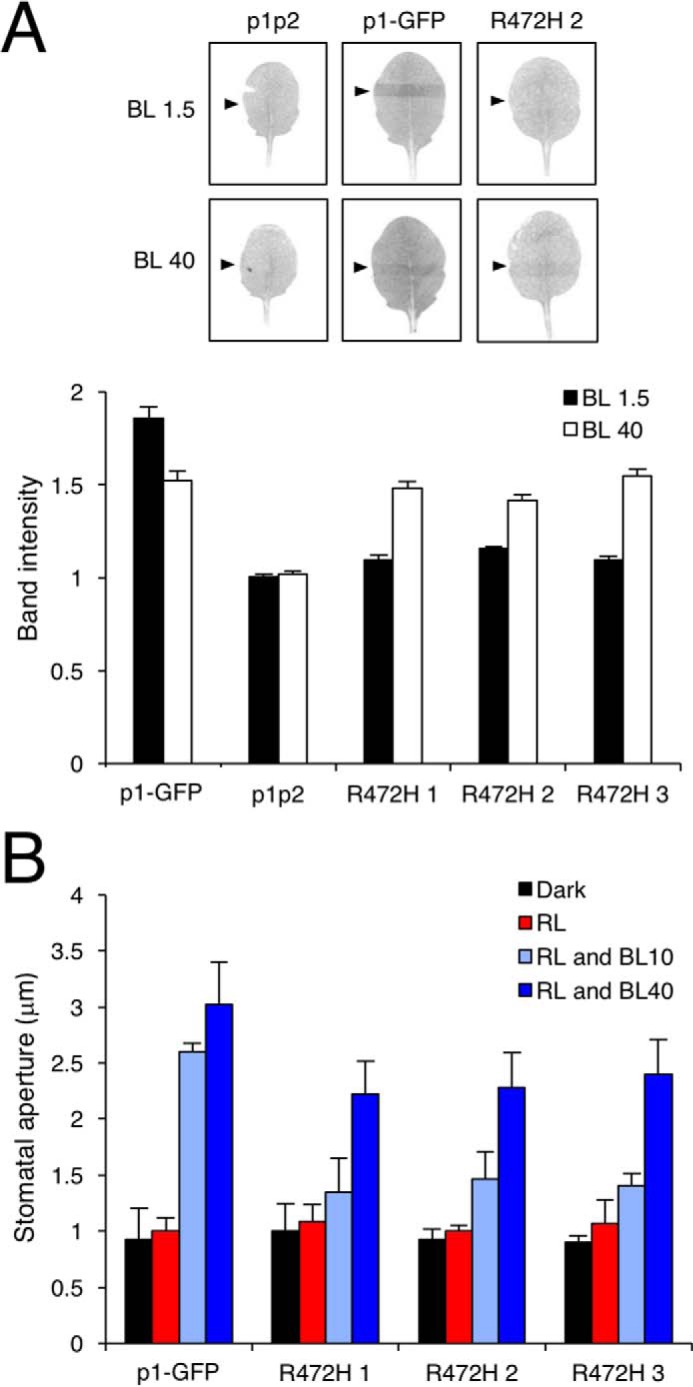
Figure 6.

Phot1 R472H complements chloroplast accumulation movement and stomatal opening at higher light intensities. A, slit band assays of chloroplast accumulation in leaves from phot1 phot2 (p1p2), p1-GFP, and three independent p1-GFP R472H transgenic lines (R472H 1–3). Detached rosette leaves were placed on agar plates and irradiated with blue light at 1.5 μmol m−2 s−1 (BL 1.5) or 40 μmol m−2 s−1 (BL 40) through a 1-mm slit for 1 h. Arrowheads indicate the irradiated areas. Slit band intensity was quantified using ImageJ, and the relative band intensities were expressed as the ratio of irradiated to non-irradiated areas. Ratios of >1 indicate accumulation. Each value is the mean ± S.E. of 12 leaves. Representative images of each of the genotypes are shown. B, blue light–induced stomatal opening responses in p1-GFP plants and each of the p1-GFP R472H transgenic lines. Epidermal strips from dark-adapted plants were irradiated with red light (RL, 50 μmol m−2 s−1) with or without blue light at either 10 or 40 μmol m−2 s−1 for 3 h. Each value is the mean ± S.E. of 90 stomata, pooled from triplicate experiments.
