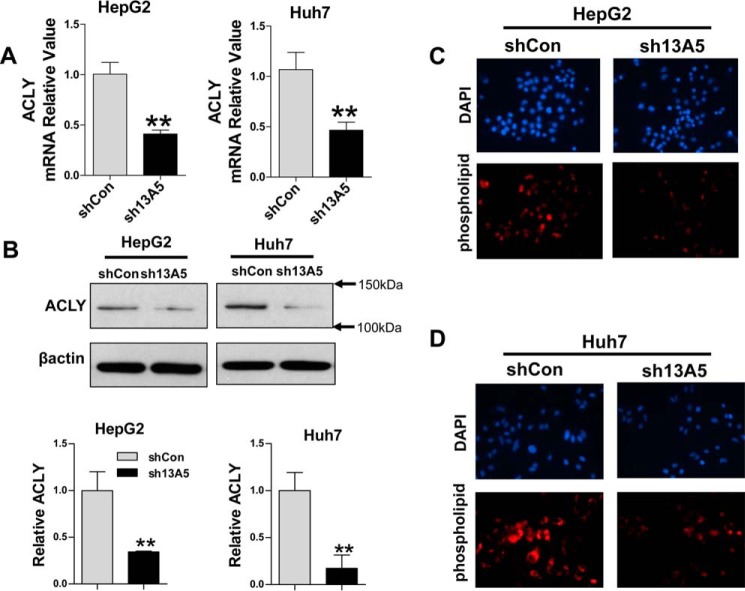
Figure 5.
Knockdown of SLC13A5 suppresses ACLY expression in HepG2 and Huh7 cells. HepG2 and Huh7 cells were infected with lentivirus encoding the sh13A5 or shCon for 72 h. A, the relative expression levels of ACLY were quantified using real-time PCR. B, the protein levels of ACLY and β-actin were measured using immunoblotting. C and D, intracellular accumulation of phospholipids was measured using phospholipids conjugated to fluorescent dyes, and representative images depict the staining of nuclei (DAPI) and phospholipid visualized under fluorescence microscopy. Data were collected from three independent experiments and expressed as mean ± S.D. in A. **, p < 0.01.

