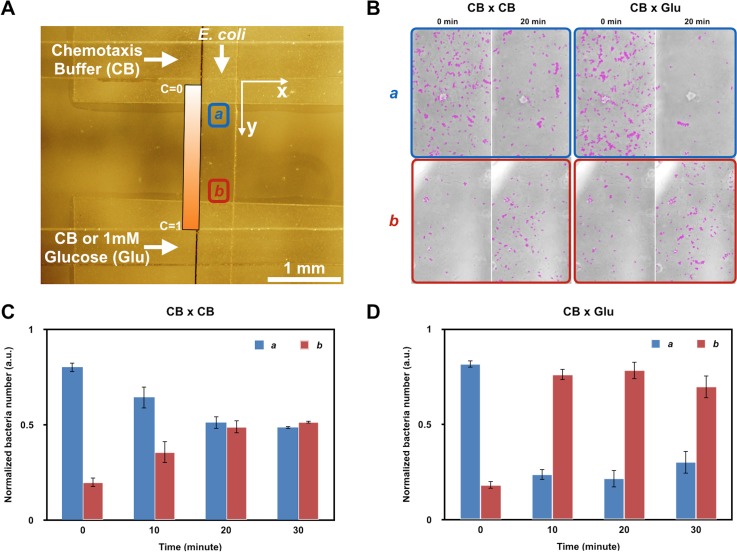
FIG. 3.
Bacterial chemotaxis experiment. (a) Bright-field image indicating the bottom channel (top to bottom) flanked by parallel sink and source channels (horizontally aligned). Imaging positions a and b are selected along the bottom channel but outside the region of the permeable polycarbonate membrane. Position a is closer to the sink channel (CB), while position b is closer to the source channel (Glu). (b) Bright-field images of positions a and b at 0 and 20 min. Cells are marked with purple circles using Imagej TrackMate software. CB × CB: the control group in which chemotaxis buffer (CB) is flowed in both sink and source channels. CB × Glu: the experimental group in which CB in the source channel is replaced with 1 mM glucose in CB. Quantitative results of (b) are shown in (c) and (d). The cell number is normalized to the total cell number in both imaging areas. Data are collected at 0, 10, 20, and 30 min. CB: chemotaxis buffer. Glu: glucose. C: concentration of glucose.

