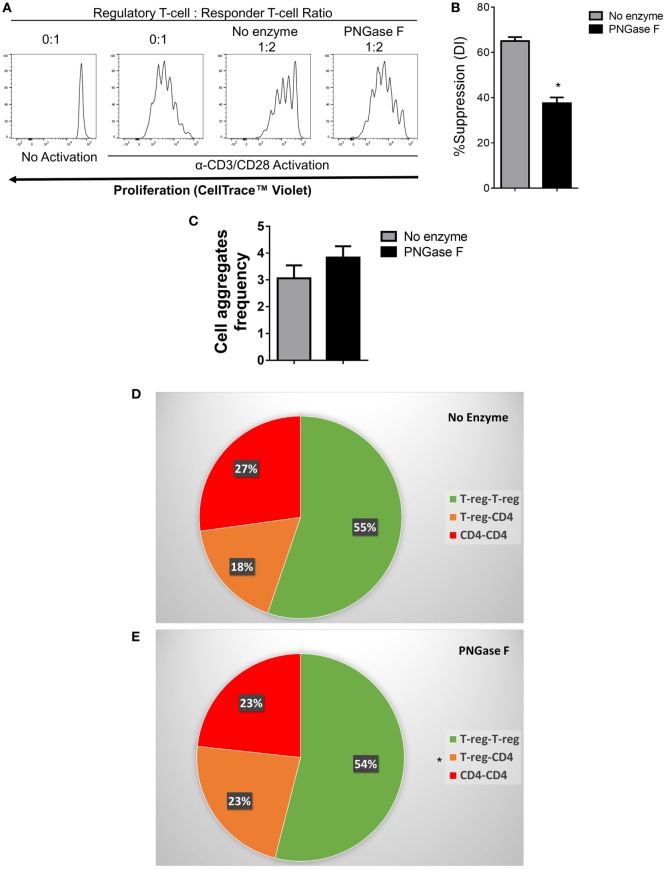
Figure 10.
Flow cytometric analysis of the suppression of CD4+ responder T-cell proliferation and immune cell interactions established by PNGase F-treated Treg in the absence of antigen presenting cells. (A–E) Fluorescence-activated cell sorting (FACS)-purified mouse CD4+ Tconv were cultured alone (0:1) or cocultured in the presence of no enzyme or PNGase F-treated Treg at Treg: responder T-cell ratios of 0:1 and 1:2 for 4 days (A,B) or 8 h (C–E) with anti-CD3/CD28 Dynabeads® stimulation. (A) Proliferation of CellTrace™ Violet-labeled CD4+ Tconv incubated under different conditions and analyzed by flow cytometry. (B) Graph of the suppressive potency of no enzyme and PNGase F-treated Treg on CD4+ T-cell responders. Suppressive function was quantified based on responder T-cell division index (DI) and presented as the calculated percent suppression [%Suppression (DI)]. For evaluation of immune cell interactions in 8 h cocultures, FACS-purified cells were fluorescently labeled as follows: Treg with CellTrace™ CFSE and CD4+ Tconv with CellTrace™ Far Red DDAO-SE. (C–E) Flow cytometric quantification of the interactions present in the cocultures at 8 h presented as (C) a graph of the overall frequency of multi-cell aggregates and (D,E) pie charts showing the calculated frequencies of the different types of multi-cell aggregates present in the cocultures with (D) no enzyme and (E) PNGase F-treated Treg. Data represent mean ± SD (n = 3 technical replicates). Statistical analysis was performed by permutation test with an unpaired design (*p value ≤ 0.1).

