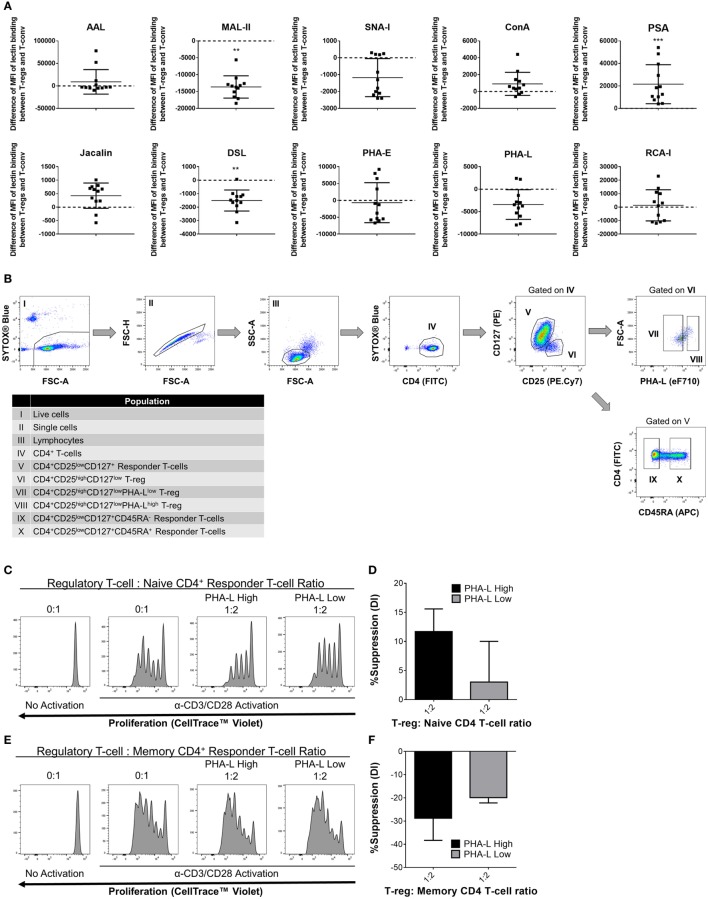
Figure 11.
Complex tri/tetra-antennary N-glycan surface expression correlates with human Treg suppressive potency. (A) Surface glycosylation of human peripheral blood mononuclear cell (PBMC) was evaluated by lectin profiling using flow cytometry. Results are shown as the difference in Median Fluorescence Intensity (MFI) of lectin binding between CD4+CD25+CD127low Treg and CD4+CD25−/lowCD127+ Tconv and are representative of results from freshly isolated PBMC (n = 12 individual subjects). Statistical analysis was performed by permutation test with a paired design (*p value ≤ 0.1; **p value < 0.05; ***p value < 0.01). (B) Gating strategy for fluorescence-activated cell sorting purification of human PBMC-derived immune cell populations for functional assays. Individual sorted populations are identified by Roman numerals and described in the text box. (C–F) Naïve CD45RA+ (C,D) and memory CD45RA− (E,F) CD4+ responder Tconv were cocultured in the presence of purified PHA-Lhigh and PHA-Llow Treg at 0:1 and 1:2 Treg: responder T-cell ratios for 4 days with anti-human CD3/CD28 Dynabeads® stimulation. (C,E) Histograms showing representative examples of responder Tconv proliferation evaluated by flow cytometric analysis of CellTrace™ Violet dilution. (D,E) Graphs of the suppressive potency of PHA-Lhigh and PHA-Llow Treg on naïve and memory CD4+ T-cell responders. Suppressive function was quantified based on responder T-cell division index (DI) and presented as the calculated percent suppression [%Suppression (DI)]. Data represent mean ± SD (n = 3 technical replicates). Results were confirmed in a repeat experiment. Statistical analysis was performed by permutation test with an unpaired design and no significant differences were identified.

