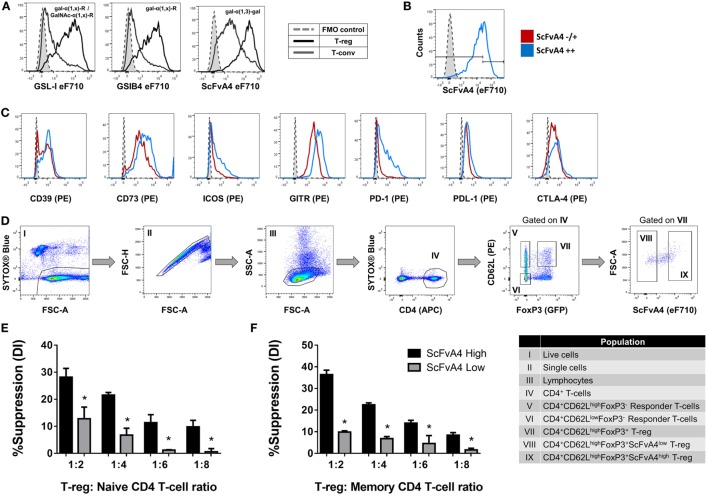
Figure 4.
Terminal alpha-galactose surface expression correlates with expression levels of Treg markers and suppressive potency. (A) Flow cytometric analysis of the surface binding intensities of α-Gal binding proteins [Griffonia simplicifolia lectin I (GSL-I), GSLB4, and anti-Gal-α-(1,3)-Gal scFv-A4] to Treg and Tconv. (B,C) Flow cytometric analysis of the expression of CD39, CD73, ICOS, GITR, PD-1, PDL-1, and CTLA-4 on Treg subpopulations defined according to low and high binding intensities of anti-Gal-α-(1,3)-Gal scFv-A4 [scFv-A4−/+ or scFv-A4++]. Dashed histograms represent the median fluorescence intensity of the fluorescence minus one (FMO) controls (n = 3 individual animals). (D) Gating strategy for purification of scFv-A4high and scFv-A4low Treg subpopulations from C57BL/6 FoxP3.EGFP mouse spleen and lymph nodes. Individual sorted populations are identified by Roman numerals and described in the text box. (E,F) Suppressive function was quantified based on responder T-cell division index (DI) and presented as the calculated percent suppression [%Suppression (DI)] for scFv-A4high and scFv-A4ow Treg of (E) naive and (F) memory CD4+ responder T-cell proliferation. Data represent mean ± SD of (n = 3 technical replicates). Results for proliferative assays were confirmed in a repeat experiment. Statistical analysis was performed by permutation test with an unpaired design (*p value ≤ 0.1).

