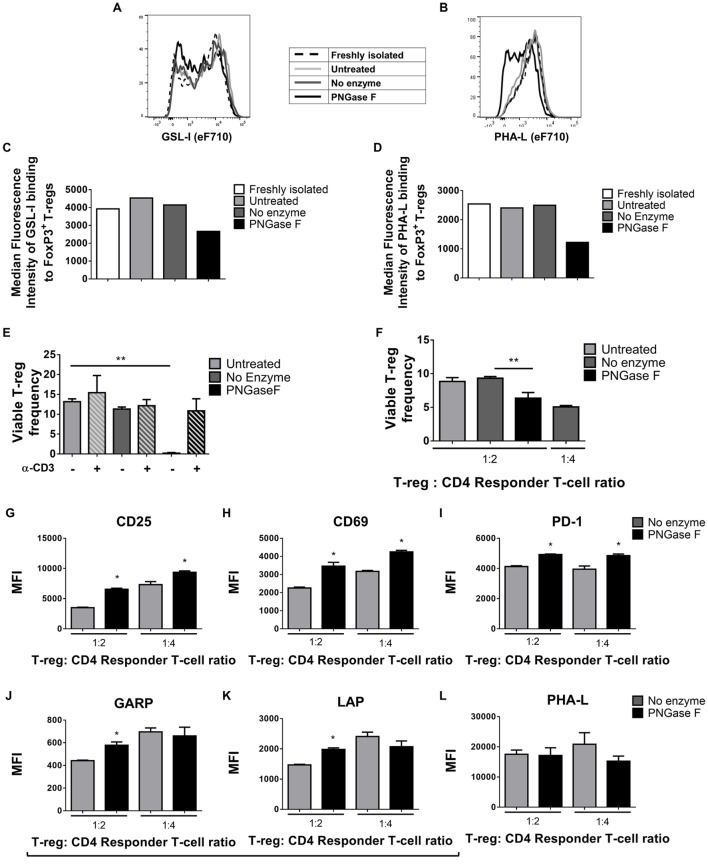
Figure 5.
Surface Griffonia simplicifolia lectin I (GSL-I) and Phaseolus vulgaris leucoagglutinin (PHA-L) binding, viability, and responsiveness to stimulus of PNGase F-treated Treg. (A–D) Flow cytometry (FCM) histogram overlays and graphs of median fluorescence intensity (MFI) of GSL-I (A,C) and PHA-L (B,D) binding to freshly isolated Treg, Treg incubated in culture medium alone (Untreated), Treg incubated in enzyme buffer alone (no enzyme) and Treg incubated in enzyme buffer containing PNGase F. For the latter three, analyses were performed immediately after incubations. (E) Frequencies of viable Treg after 24 h coculture with antigen-presenting cells (APCs) with and without anti-CD3 activation assessed by FCM using SYTOX® AADvanced dead cell stain. (F–M) Treg were cocultured with CD4+ Tconv at 0:1, 1:2, and 1:4 Treg: responder T-cell ratios in the presence of APCs and anti-CD3 activation for 24 h, after which (F) the frequency of viable Treg and (G–M) Treg expression of several surface proteins were evaluated. Graphs show surface expression levels (MFI) of (G) CD25, (H) CD69, (I) PD-1, (J) GARP, (K) LAP, and (L) complex tri/tetra-antennary N-glycans (PHA). (M) Frequency of LAP single positive (LAP SP) and GARP and LAP double positive (GARP&LAP DP) Treg after 24 h coculture. (A–D) Data are representative of one of five separate experiments. (E–M) Data represent mean ± SD (n = 3 technical replicates). Statistical analysis was performed by permutation test with an unpaired design (*p value ≤ 0.1; **p value < 0.05).


