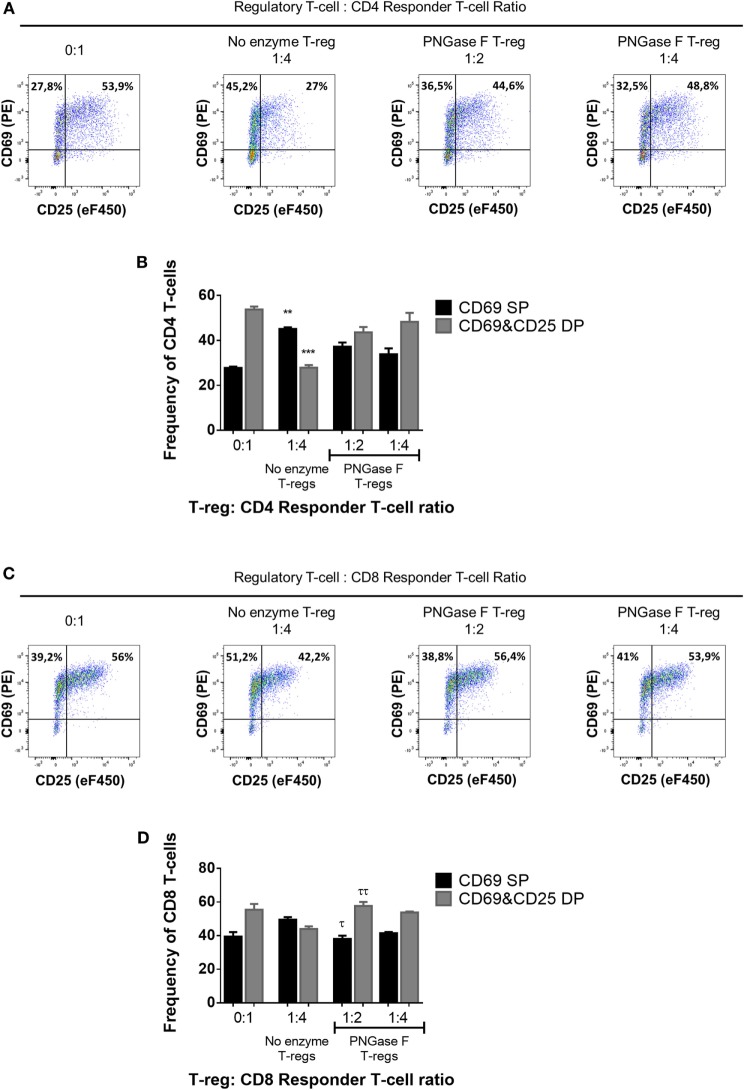
Figure 7.
Manipulation of surface N-glycosylation impairs the early suppressive potency of murine Treg. (A–D) Fluorescence-activated cell sorting-purified CD4+ (A,B) and CD8+ (C,D) Tconv were cocultured in the presence of CD4−CD8− antigen-presenting cells without Treg (0:1) and with no enzyme or PNGase F-treated Treg at Treg: responder T-cell ratios of 1:2 and 1:4 for 24 h with anti-CD3 stimulation. Suppressive function was evaluated based on inhibition of (A,B) CD4+ and (C,D) CD8+ responder T-cell upregulation of CD25 and CD69 after 24 h coculture and is presented as the frequencies of CD69 single positive (CD69 SP) and CD69 and CD25 double positive (CD69&CD25 DP) cells for cocultures containing no enzyme and PNGase F-treated Treg. (A,C) Representative flow cytometric dot plots of the expression of the activation markers CD25 and CD69 on Tconv populations. The frequencies of CD69 SP (top left quadrant) and CD69 and CD25 double positive (top right quadrant) Tconv are shown for four coculture conditions: no Treg (0:1); no enzyme Treg at 1:4 Treg: responder T-cell ratio; PNGase F-treated Treg at 1:2 Treg: responder T-cell ratio and PNGase F-treated Treg at 1:4 Treg: responder T-cell ratio. (B,D) Graphs showing the relative distribution and frequency of cells with differential CD69 and CD25 expression in the different culture conditions. Data represent mean ± SD (n = 3 technical replicates). Results were confirmed in three independent experiments. Statistical analysis was performed by permutation test with an unpaired design comparing the coculture with the different Treg populations to the no Treg condition (*p value ≤ 0.1; **p value < 0.05; ***p value < 0.01) and between the PNGase F and the no enzyme Treg cocultures (τp value ≤ 0.1; ττp value < 0.05).

