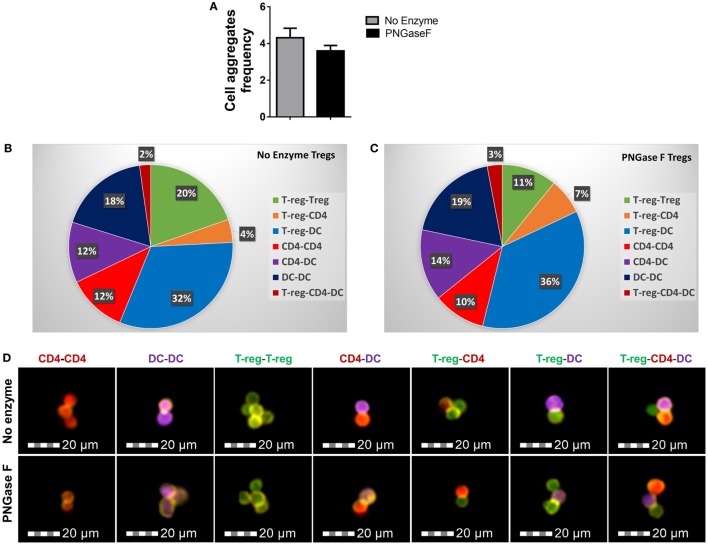
Figure 9.
PNGase F treatment does not affect Treg ability to interact with other immune cells. (A–D) CD4+ responder T-cells were cocultured with CD11c+ dendritic cells (DCs) and purified Treg (no enzyme or PNGase F-treated) at Treg: responder T-cell ratios of 1:2 for 8 h with anti-CD3 stimulation. Prior to coculture, Treg were fluorescently labeled with CellTrace™ CFSE (CFSE), DCs with CellTrace™ Violet (CTV) and CD4+ Responder T-cells with CellTrace™ Far Red DDAO-SE (Far red). Immune cell interactions were quantified by flow cytometry. (A) Graph of the frequency of cell aggregates and (B,C) pie charts showing the proportionate frequencies of the different types of multi-cell aggregates present in the cocultures with (B) no enzyme and (C) PNGase F-treated Treg. (D) Imaging flow cytometric analysis of the immune cell interactions. Immunological synapse formation was identified by selective F-actin staining with Alexa Fluor® 568 phalloidin (yellow stain). Representative examples of different types of immune cell aggregates present in the cocultures are presented for no enzyme and PNGase F-treated Treg cocultures. Data for (A–C) represent overall mean result from three identical experiments each with three technical replicates per condition (n = 9). Statistical analysis was performed by permutation test with an unpaired design and no significant differences were identified.

