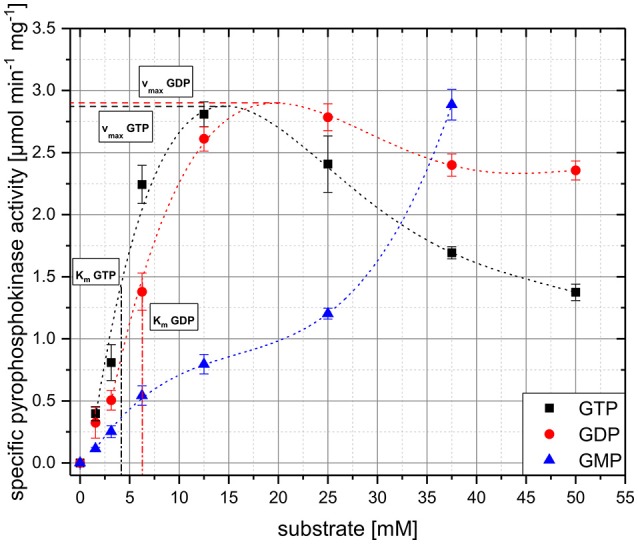
Figure 5.

Kinetics of RelSCg with respect to the concentrations of GMP, GDP, and GTP as substrates. Specific activity was determined for different substrate concentrations by in vitro analysis and given in μmol per minute per milligram of RelSCg. In order to illustrate the data and the graphical determination of the kinetic parameters Km and vmax, a polynomial fit was performed for all substrates and displayed as a dashed line. Km and vmax values for GDP and GTP are represented as vertical and horizontal dashed lines, respectively. For GMP the parameters could not be determined due to the untypical activity profile. Mean values and standard deviations shown were calculated from three replicates.
