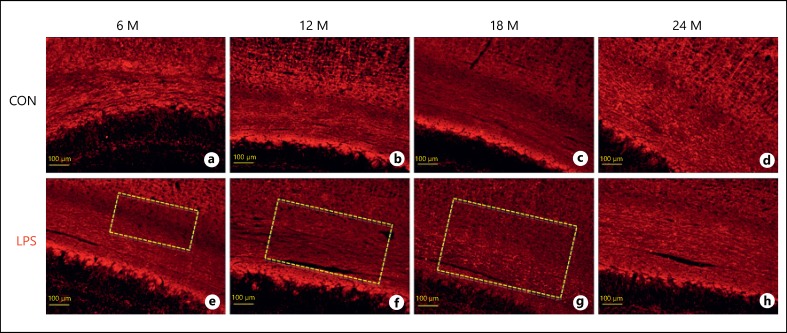
Fig. 2.
a-h Immunofluorescence images of the corpus callosum of the rat brain sections immunolabeled with anti-myelin oligodendrocyte glycoprotein antibody and visualized with tetramethylrhodamine at various age points depicting the loss of myelinated fibers following neonatal LPS exposure (n = 3). The demyelinating lesions are indicated with dotted rectangle. Scale bar = 100 μm.

