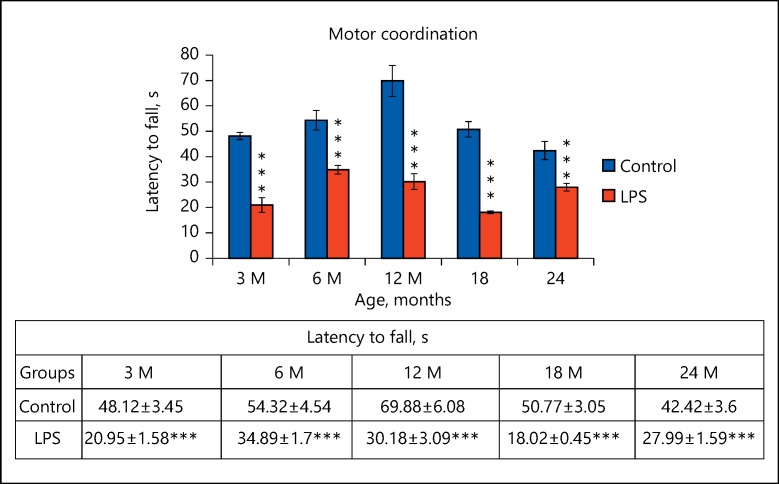
Fig. 5.
Graph showing the performance of the animals as total time spent on the accelerating wheel of the rotarod in both control and neonatally lipopolysaccharide (LPS)-exposed animals at various age groups. Data are presented as latency to fall (mean ± SE). *** p < 0.001 for LPS vs. control (n = 12; t test followed by post hoc Mann-Whitney rank sum test).

