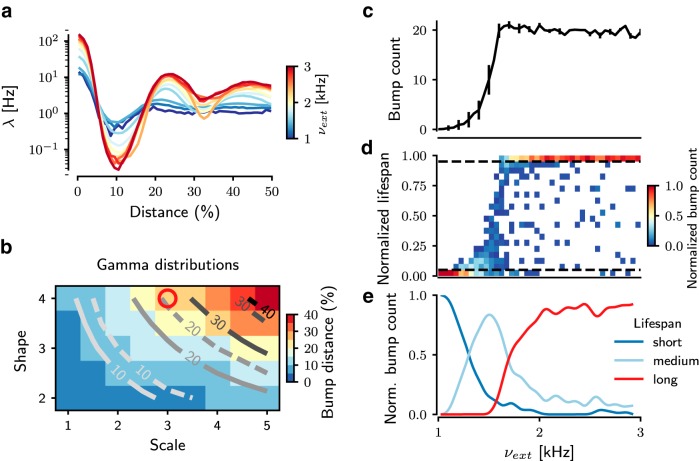
Figure 4.
Quantification of bump activities in gamma networks. a, Spatial autocorrelation of the network spiking activity, showing the mean firing rate () of each bump as a function of the distance from the cluster centroid normalized to the full size of the network. Different colors represent the strength of the background excitation. b, Distance between bumps in various gamma distributions and its comparison between numerical simulations and mean field equations. The background color is measured bump distance from the network simulation data. Solid traces show results from analytical estimation of bump distance; dashed traces represent the estimation of bump distance from network simulations. The parameter for the gamma-distributed connection is used for the spiking network model (red circle). Spatial representations of activity bumps are also observed in Fig. 5 (c–e). These subfigures display the bump count and their relative lifespan during the entire simulation as a function of the background external excitation (νext), which modulates the nature of the bump activity. c, With increasing νext, the number of bumps increases in a sigmoidal fashion. For higher νext, the number of bumps saturates, owing to the limited capacity of the finite spatial map. The error bars for the bump counts indicate the standard deviation of bump counts over the simulation time. d, The lifespan of bumps reflects the dynamic state of the bumps: a shorter lifespan reflects TA dynamics, whereas a larger lifespan indicates stable bump activity reflecting WTA dynamics. By increasing νext, the distribution of lifespans shifts from short to long term. The ordinate indicates lifespan, normalized to the duration of the entire simulation (10 s), of individual bumps. Because the average bump counts are different in each dynamical state (TA, WTA), we normalized the color bar of bump count to the average bump count in individual states. e, The lifespan distribution is split into three groups (dashed lines in d). The long (red trace) appearance of bumps reflects the WTA state of bump activity, whereas the short (blue trace) appearance of bumps reflects the TA state of bump activity. Between these two states, the network is in a highly unstable state, characterized by a wider distribution of lifespans (light blue trace).

