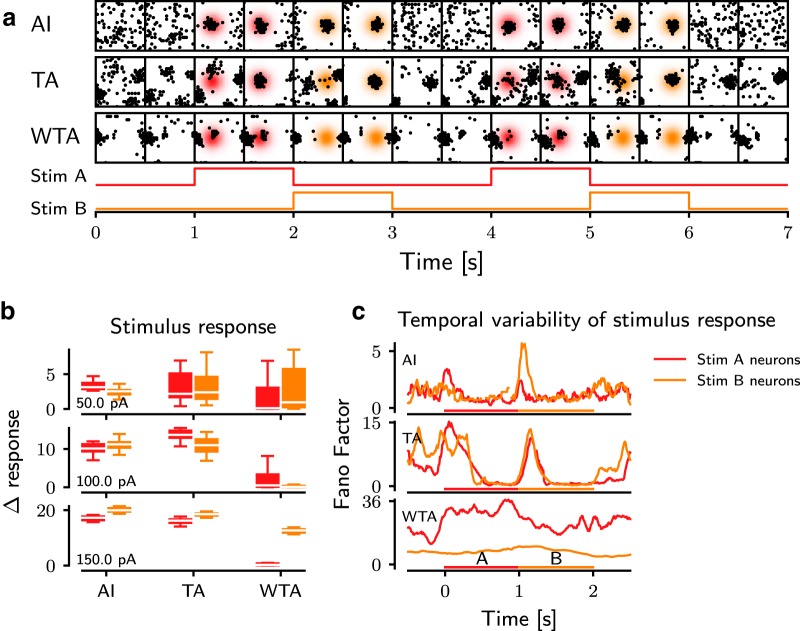
Figure 7.
Impact of the network dynamics on the stimulus response. a, Spatial distribution of the spiking activity displayed in time series for different dynamic states (rows). Each frame shows a spatial map of 30 × 30 neurons from the ROI (black squares) in a time window of 100 ms, with 500-ms intervals between successive frames. The gradient background is the probability area for stimulated neurons, and its color refers to a stimulus phase. b, The change of response activity of the stimulated neurons to their corresponding stimuli A (red) or B (orange) in different ongoing bump states (AI, TA, and WTA). Each row represents the strength of the stimuli (50–150 pA). A lower Δresponse indicates a weaker impact of the external stimuli on the network activity, and lower variance of activity reflects a higher reliability of the response. For each subpanel, the white lines are the median value of the data. The colored boxes extend from the 25% to 75% of the data, i.e., the box contains ≈50% of the data. Whiskers extend from minimum to maximum values of the data. c, The temporal variability (FF) of the response of the stimulated neurons as a function of time. A lower FF indicates a higher reliability of the stimulus response. A higher FF is observed at each stimulus onset, in both the AI and TA states. In contrast, in the WTA state, the network is not able to reliably respond to external stimuli. Both stimulus phases are displayed at the bottom of each subpanel.

