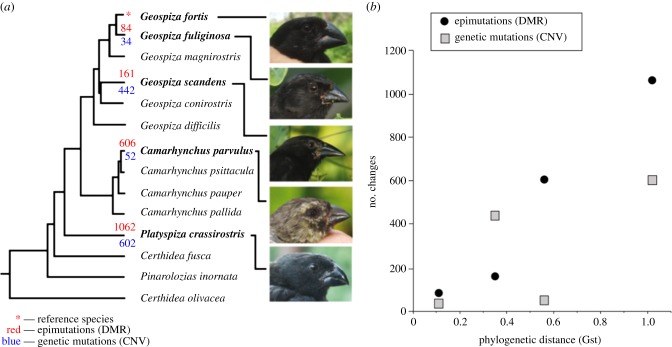
Figure 4.
(a) Five of the Galapagos finch species were studied, the reference species Geospiza fortis and four others. The graph in (b) shows the number of genetic and epigenetic changes plotted as a function of phylogenetic distance. The epigenetic changes correlate well with phylogenetic distance, the genetic mutations do not correlate as strongly [38]. (Online version in colour.)

