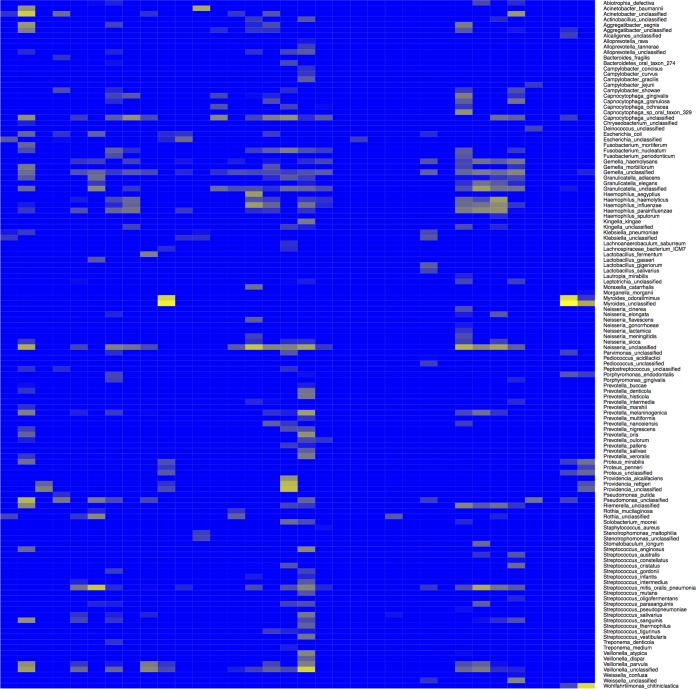
FIG 4 .
Heat map showing the bacterial species (y axis) identified mapping to nucleic acids in a swab sample taken from an individual patient. All patients in this category were deceased at the time of sampling (n = 24). The color represents the arbitrary read depth of the sequence, with yellow indicating a greater sequence read depth.

