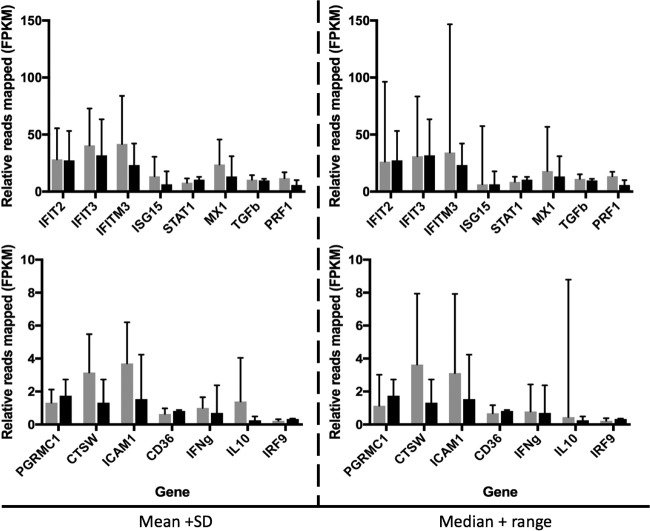
FIG 7 .
Relative abundance of transcripts mapping to host transcripts associated with malaria and the innate immune response in patients with EVD who were confirmed positive (gray; n = 10) or negative (black; n = 13) for P. falciparum (by RNA-seq and RDT). Relative gene expression levels were measured as the fragments per kilobase of transcript per million mapped reads (FPKM). Each set of graphs (left and right) is based on average FPKM values. Two analyses of the data are presented, and means and standard deviations (left) or medians and total ranges (right) are shown.

