
Figure 1.
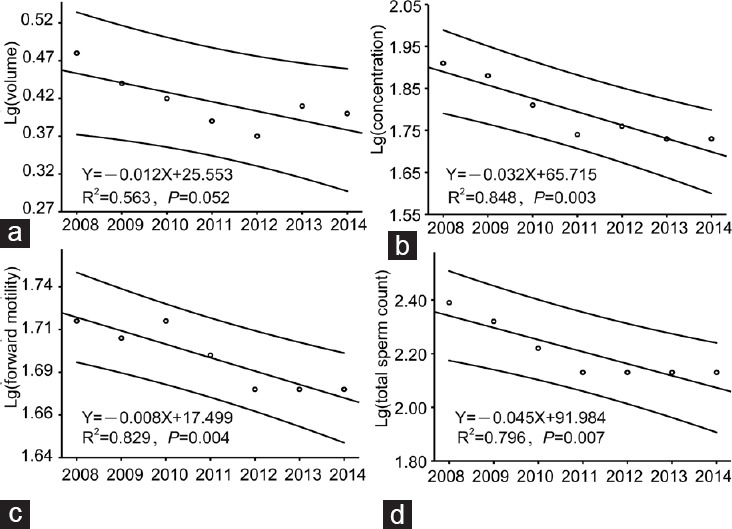
Linear regression lines of the means per year of the main sperm parameters. For each parameter, the graph shows the linear regression line with 95% confidence interval over the study period. Significant decreases in mean semen volume (a), mean sperm concentration (b), mean sperm forward motility (c), and mean total sperm count (d) were observed.