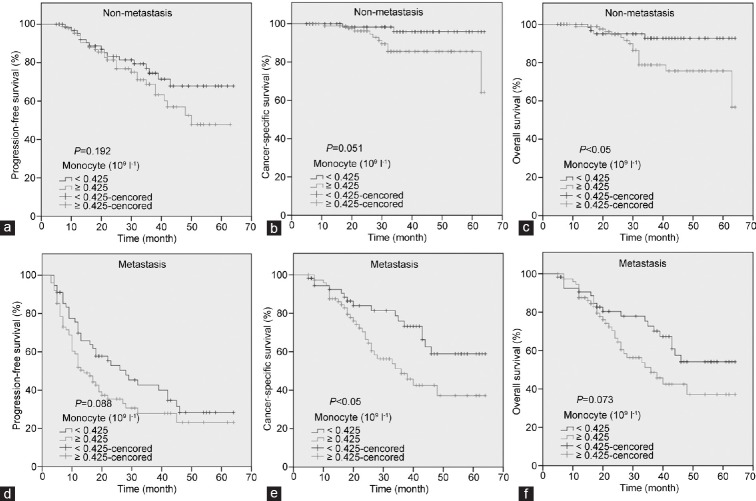
Figure 4.
Kaplan–Meier survival curves stratified by peripheral monocyte count in prostate cancer patients. In the nonmetastasis subgroup, the progression-free survival (PFS), cancer-specific survival (CSS), and overall survival (OS) were shown in (a–c), respectively. In the metastasis subgroup, the PFS, CSS, and OS were shown in (d–f), respectively.

