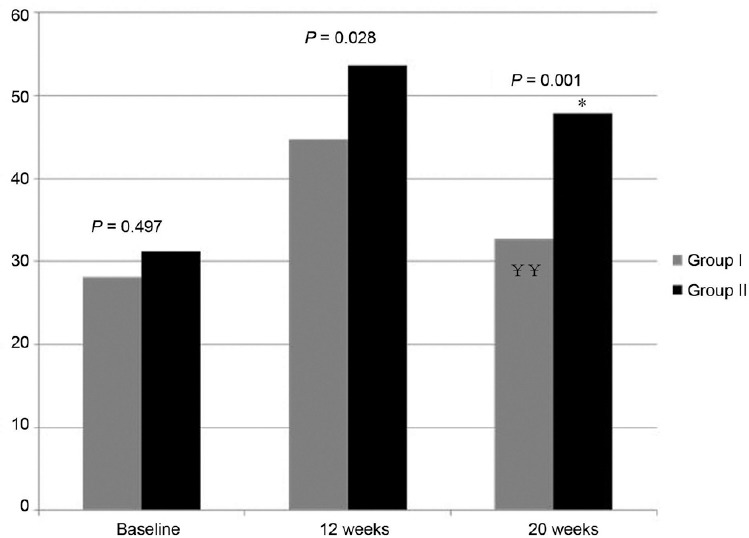
Figure 2.

Changes of total score of IIEF and comparison between two groups (P value by independent t-test, P = 0.028 at 12 weeks, P = 0.001 at 20 weeks). ¥¥P < 0.001 by paired t-test compared to 3 months in Group I, *P < 0.01 by paired t-test compared to 3 months in Group II.
