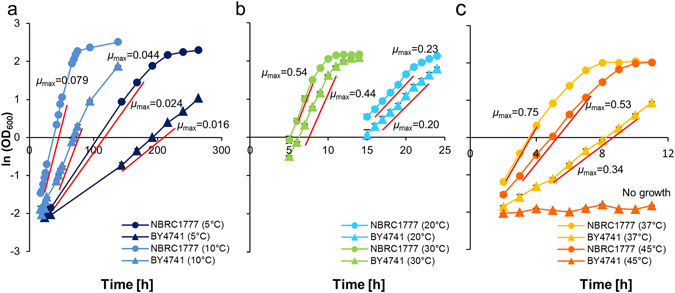
Figure 1.

Cell growth of K. marxianus and S. cerevisiae at various temperatures. Cell growth was compared between K. marxianus NBRC1777 and S. cerevisiae BY4741 at 5, 10 °C (a), at 20, 30 °C (b), and at 37, 45 °C (c). The maximum specific growth rate (µ max) was determined as the slope of the mid-log phase of natural logarithm (ln) (OD600). Timeframes for each µ max were as follows: at 5 °C from 33 h to 168 h and 144 h to 216 h, at 10 °C from 19 h to 48 h and 42 h to 75 h, at 20 °C from 16 h to 20 h and 16 h to 22 h, at 30 °C from 6 h to 8 h and from 6 h to 10 h, at 37 °C from 2 h to 4 h and 5 h to 10 h, 45 °C from 3 h to 7 h and no growth for K. marxianus and S. cerevisiae, respectively.
