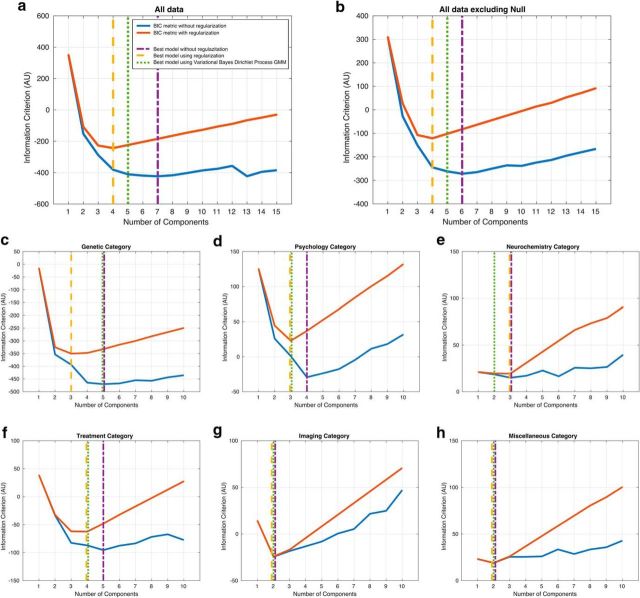
Figure 2.
Model comparison and model selection analysis for GMMs, regularized GMMs, and DPGMMs. The blue and red lines display BIC scores (natural log scale) for nonregularized GMMs and regularized GMMs, respectively, for different levels of model complexity (number of mixture components). The lowest BIC score indicates the model that provides the best compromise between model fit (likelihood) and model complexity for the given dataset. Winning models for GMMs (purple dotted-dash vertical line), regularized GMMs (yellow dashed vertical line), and DPGMMs (green dotted vertical line) are clearly present for each dataset, enabling direct comparison of the output for each methodology. The regularized GMM approach provided the most parsimonious interpretation of the data on the two main datasets: all studies (a), excluding null studies (b) as well as five out of six subfield datasets (c–h).

