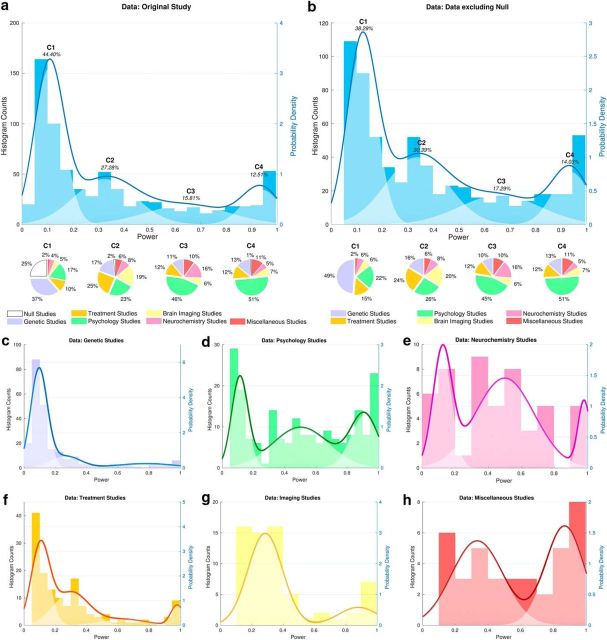
Figure 3.
Power of studies. Shown are histograms depicting the distribution of study powers across all 730 studies (a) and across studies excluding null meta-analyses (b). However, we note that excluding power statistics from studies included in null meta-analyses may provide an overestimation of power because, in many instances, there remains uncertainty as to whether a true effect exists. Pale overlay shows the results of the regularized GMM, identifying four components (C1, C2, C3, and C4) and their relative weights within the dataset. Below the histogram, pie charts depict methodological subfields and null meta-analyses contributing to each component. The null studies (white pie-chart sections) comprise 52 genetic studies and 40 treatment studies. The dark blue line shows the sum of the components (overall GMM prediction). c–h, Histograms depicting the distribution of study powers across all meta-analyses separated by subfield: candidate gene association studies (c), psychology studies (d), neurochemistry studies (e), treatment studies (f), imaging studies (g), and miscellaneous studies (h). Pale overlays show the results of the regularized GMM for each subfield; the dark lines show the sum of the components (overall GMM prediction).

