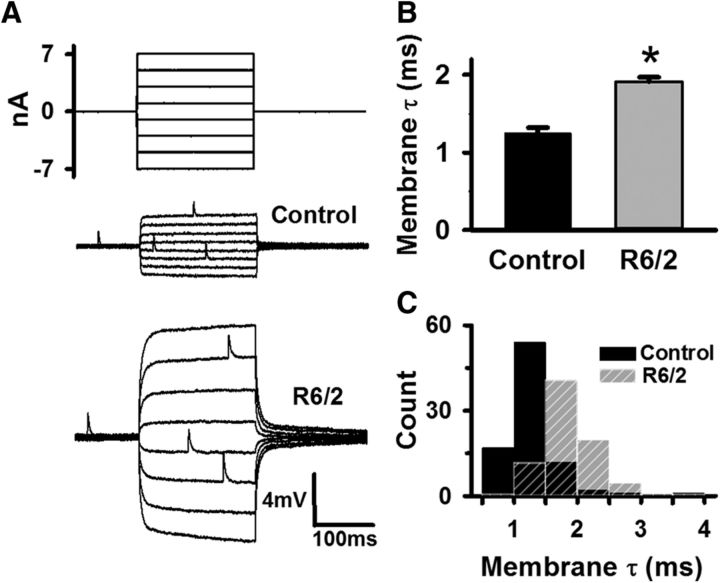
Figure 1.
Increased membrane time constant (τm) indicative of hyperexcitable R6/2 skeletal muscle fibers. A, Injected current steps (top traces) and the resulting membrane potential responses in representative control and R6/2 muscle fibers (bottom traces) in normal calcium. B, Average control and R6/2 τm. C, Histogram of control (solid black bars) and R6/2 (striped gray bars) τm. *Indicates a significant difference compared with control (p = 5.94 × 10⁻⁶, t test). Regions of overlap as black striped bars. Error bars are ±SEM.

