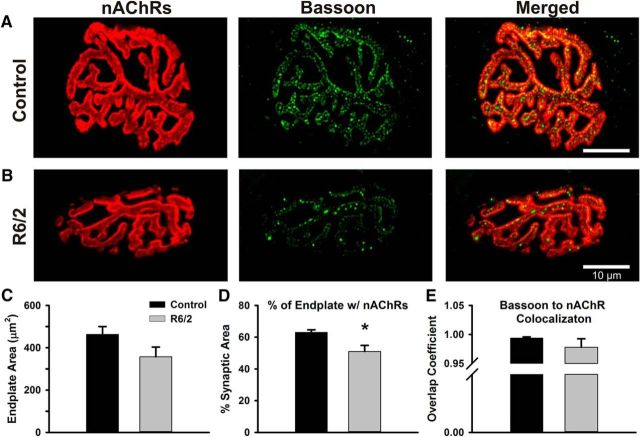
Figure 10.
Comparison of R6/2 and control NMJs stained for postsynaptic nAChRs and presynaptic bassoon proteins. A, B, Representative control (A) and R6/2 (B) NMJs stained for nAChRs on the motor endplate (red, left), bassoon in the motor nerve terminals (green, middle), and the merge image of the nAChR and bassoon staining (right). nAChRs were stained with α-bungarotoxin-AlexaFluor 555 and bassoon was detected by immunofluorescence. C, Total endplate area for control (black bar) and R6/2 (gray bar) NMJs determined by circumscribing the nAChR staining region. D, The percentage of the control (black bar) and R6/2 (gray bar) endplate occupied by nAChR. This estimate of synaptic area was significantly less in R6/2 compared with control NMJs (p = 0.01, t test). E, The overlap coefficient of bassoon to nAChR in control (black bar) and R6/2 (gray bar) NMJs. A value of 1 indicates that each pixel of bassoon staining (green) colocalized with red pixels (nAChR). *Indicates a significant difference compared with control NMJs. Error bars are ±SEM.

