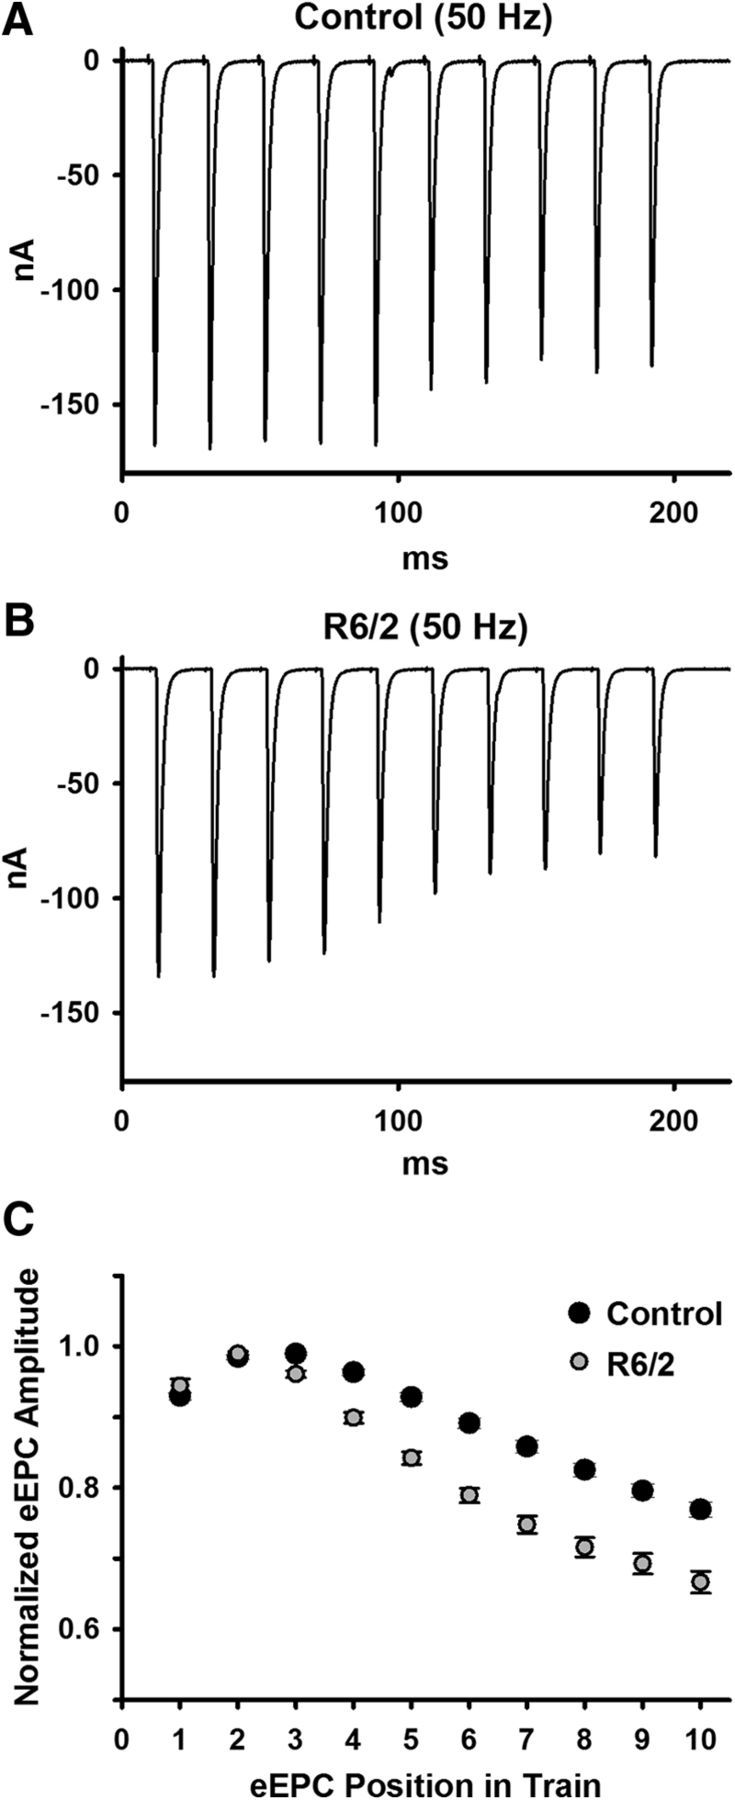
Figure 11.

eEPC depression during high-frequency (50 Hz) stimulation trains. A, B, Representative raw traces for control (A) and R6/2 (B) NMJs. C, Average control (10 mice) and R6/2 (7 mice) eEPC amplitudes normalized to the peak eEPC amplitude in a train of 10 eEPCs at 50 Hz stimulation. Error bars are ±SEM.
