Figure 3.
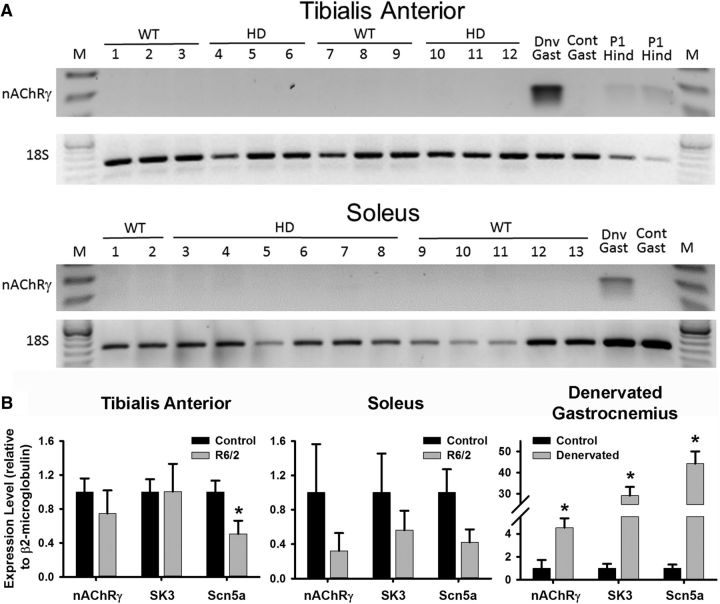
RT-PCR analyses of the expression of denervation-induced gene mRNAs in R6/2 and control mice. A, Gel-based RT-PCR for the expression of nAChRγ. Neither control nor R6/2 tibialis anterior nor soleus muscles showed expression of nAChRγ. In contrast, expression of nAChRγ was detectable in denervated (Dnv), but not control (Cont) mouse gastrocnemius (Gast) muscle. Also, expression of nAChRγ was observed in postnatal day 1 (P1) hindlimb muscles (Hind) of mice. The M designates base-pair size markers. B, Real-time RT-PCR analyses of nAChRγ, the SK3, and Scn5a mRNAs relative to β2-microglobulin in control and R6/2 mice. No significant changes in the mRNAs for nAChRγ and SK3 were observed in R6/2 mouse tibialis anterior (left; nAChRγ: p = 0.398, t test; SK3: p = 0.991, t test) and soleus (middle; nAChRγ: p = 0.289, t test; SK3: p = 0.403, t test) muscle compared with control. There was a significant decrease in the levels of Scn5a in R6/2 tibialis anterior (p = 0.025, t test) but not soleus muscle (p = 0.094, t test) relative to control. In contrast, there was a marked increase in the expression of nAChRγ (p = 0.0099, t test), SK3 (p = 0.0002, t test), and Scn5a (p = 0.0001, t test) mRNA in denervated gastrocnemius relative to the innervated contralateral muscle in control mice (n = 4 muscles/group). *Indicates a significant difference. Error bars are ±SEM.

