Figure 5.
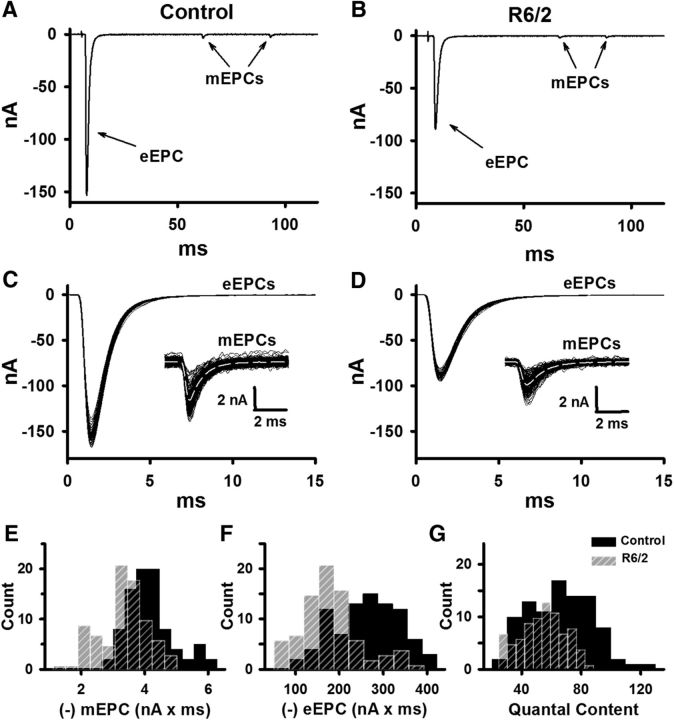
The mEPC charge, eEPC charge, and QC in control and R6/2 NMJs in physiological extracellular Ca2+ (1.2 mm) and Mg2+ (0.6 mm). A, B, Representative control (A) and R6/2 (B) recordings under two-electrode voltage-clamp showing mEPCs and eEPCs (baseline adjusted to 0). C, D, Superimposed representative eEPC traces from control (C) and R6/2 (D) NMJs with an inset of superimposed mEPC traces from the same NMJs. E–G, Histograms of average control (solid black bars) and R6/2 (striped gray bars) mEPC charge (E), eEPC charge (F), and QC (G). Regions of overlap as black striped bars.

