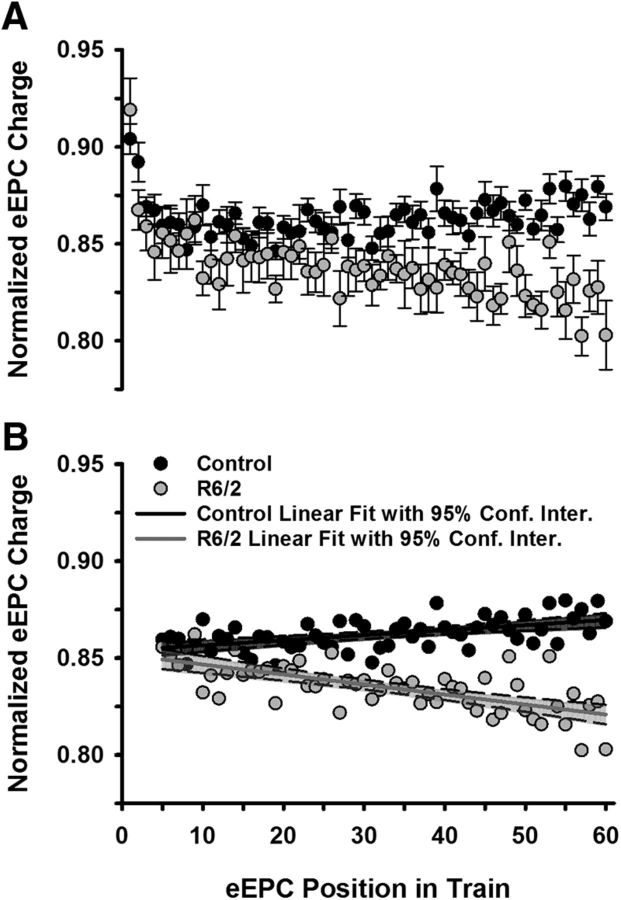
Figure 6.
Synaptic modulation at low-frequency stimulation (0.5 Hz). A, Average control (10 mice) and R6/2 (7 mice) eEPC charges normalized to the peak eEPC charge in a train of 60 eEPCs stimulated at 0.5 Hz. B, Normalized eEPCs (postion 5–60 in train) from A showing the linear regression for control (solid black line) and R6/2 (solid gray line). Data are shown with the 95% confidence interval for each linear regression (control shaded black and R6/2 shaded gray). Error bars are ±SEM.

