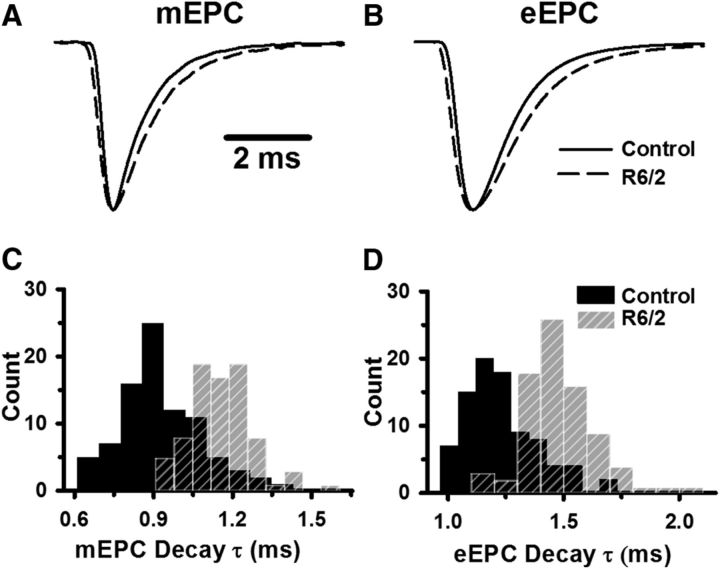
Figure 7.
Kinetics of control and R6/2 mEPCs and eEPCs. A, B, Average mEPC (A) and eEPC (B) from representative control (solid lines) and R6/2 (dashed lines) NMJs, each normalized to peak (peak value set to 1 for each endplate current). C, D, Histograms of the control (solid black bars) and R6/2 (striped gray bars) mEPC decay constants (C) and eEPC decay constants (D). Regions of overlap as black striped bars.

