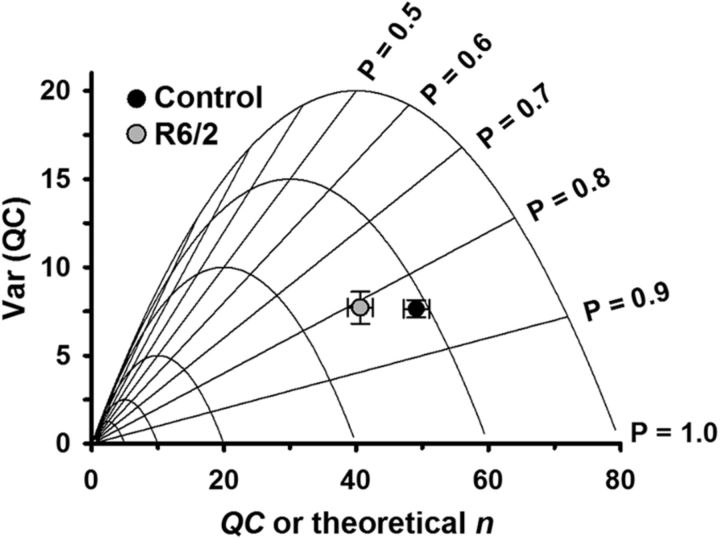
Figure 9.
Var(QC) versus QC plot for estimating the probability of release (prel) and number of vesicle release sites (n). Experimental Var(QC) and QC data superimposed on two theoretical models (parabolas and straight lines). The parabolas model Var(QC) and QC while varying prel and holding n constant. Straight lines model Var(QC) and QC while varying n and holding prel constant. The lower QC (vesicle release per impulse) in R6/2 compared with control fibers was primarily due to a lower n. Error bars are ±SEM.

