Figure 5.

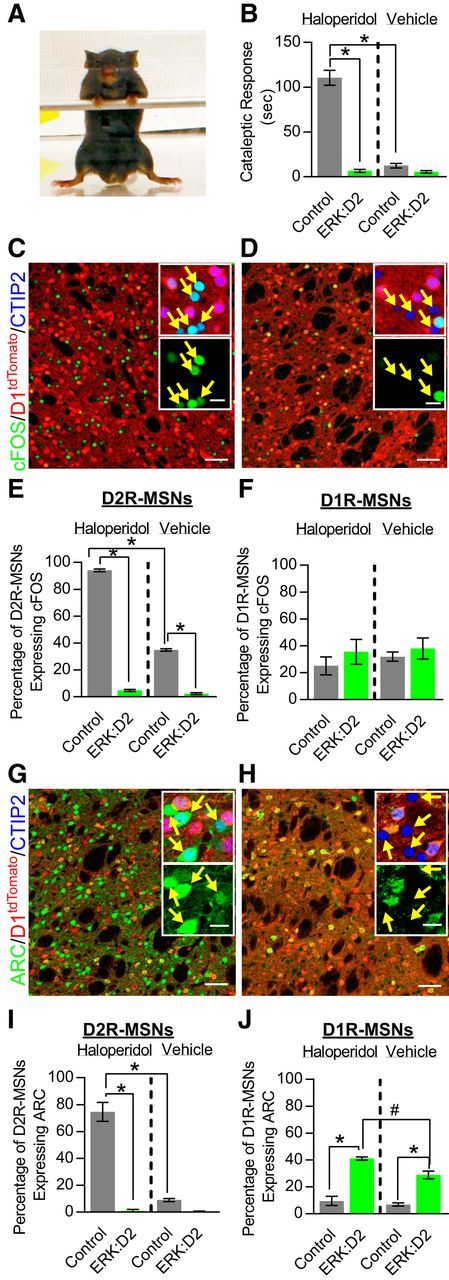
Activity-regulated gene expression is strongly suppressed in ERK-deleted D2R-MSNs. A, Representative image of cataleptic response to haloperidol using horizontal bar test. B, Quantification of cataleptic response (freezing) to haloperidol (1 mg/kg) or vehicle in littermate control and ERK:D2 mutant mice. Control mice exhibit a robust cataleptic response to haloperidol compared with vehicle-treated controls (*p = 0.001, n = 7 mice/genotype/condition). The cataleptic response is effectively abolished in the mutant mice (*p = 0.001, haloperidol-treated ERK:D2 vs haloperidol treated control; n = 7 mice/condition). Vehicle-treated mice show no cataleptic response (n = 7 mice per genotype per treatment). C, D, c-FOS (green) expression in control and ERK:D2 mutant striatum 1 h after haloperidol administration. CTIP2 (blue) identifies all MSNs; D1tdTomato (red) identifies the D1R-MSN subpopulation. All D2R-MSNs are CTIP2(+);tdTomato(−). Insets are magnified images showing all three labels (top) and c-FOS only (bottom) demonstrating that c-FOS is strongly upregulated in D2R-MSNs (yellow arrows) in control (C) but not ERK:D2 animals (D). E, Quantification of MSN-specific c-FOS expression after haloperidol (1 mg/kg) or vehicle administration (*p < 0.001; n = 3 mice/genotype; 200–250 cells/mouse). F, No changes in c-FOS expression are observed in D1R-MSNs in either control or ERK:D2 mutant animals. (n = 3 animals/genotype, 200–250 cells/animal). G, H, ARC (green) expression in control and ERK:D2 mutant striatum 1 h after haloperidol administration. CTIP2 (blue) identifies all MSNs; D1tdTomato (red) identifies the D1R-MSN subpopulation. All D2R-MSNs are CTIP2(+);tdTomato(−). Insets are magnified images demonstrating that ARC is upregulated in D2R-MSNs (yellow arrows) in control (G) but not ERK:D2 animals (H). I, Quantification of D2R-MSN-specific ARC expression after haloperidol (1 mg/kg) or vehicle administration (*p < 0.001; n = 3 mice/genotype; 200–250 cells/mouse). J, D1R-MSNs in ERK:D2 mutant mice express significantly more ARC compared with controls regardless of treatment (#p < 0.05, *p < 0.001; n = 3 mice/genotype; 200–250 cells/mouse). All data are presented as mean ± SEM. Scale bar, 50 μm; inset, 10 μm.
