
Figure 7.
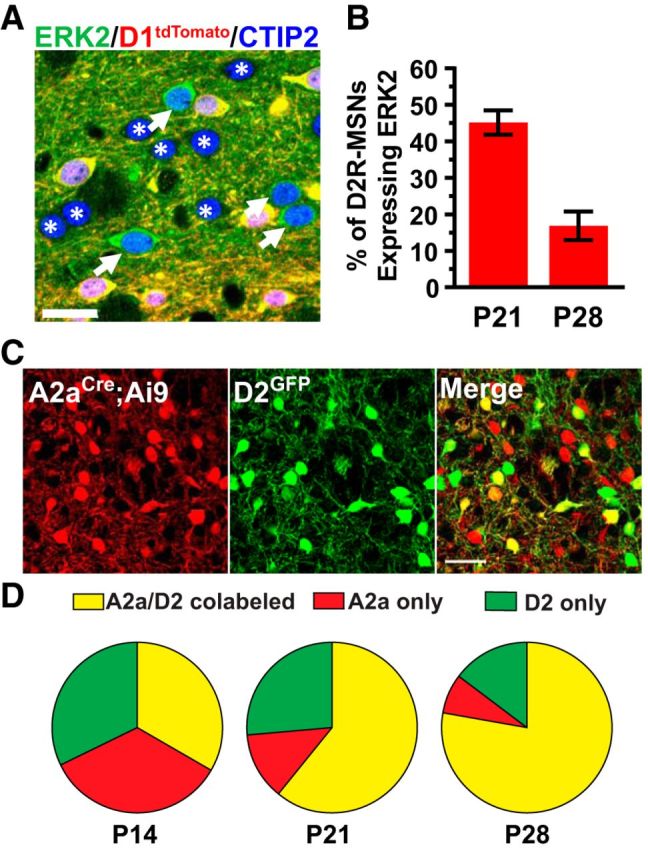
Delayed loss of ERK activity in ERK:A2a mice. A, Representative image of P21 ERK:A2a striatum. CTIP2 (blue) labels all MSNs, whereas D2R-MSNs are identified as negative for D1tdTomato expression (red). A subpopulation of D2R-MSNs in ERK:A2a mutants maintain ERK2 expression (green, white arrows). ERK2-deficient D2R-MSNs are indicated with a white asterisk. Scale bar, 20 μm. B, Quantitative analysis of ERK2 expression in P21 and P28 ERK:A2a striatum. Approximately half of all D2R-MSNs maintain ERK2 expression at P21. By 28, ∼15% of D2R-MSNs continue to express ERK2. (n = 3 animals/genotype; 500–600cells/animal). C, Colocalization of D2GFP (green) and A2aCre:Ai9 (red) at P14. Scale bar, 50 μm. D, Quantification of D2GFP and A2aCre:Ai9 colocalization at P14, P21, and P28. All data are presented as a percentage of total D2R-MSNs counted. Note that the percentage of D2R-MSNs that express both GFP and Ai9 is low at P14. The percentage increases over time, but complete recombination in D2R-MSNs is not observed, even by P28 (n = 3 animals/time point; 500–600 cells/animal). All data are presented as mean ± SEM.