
Figure 3.
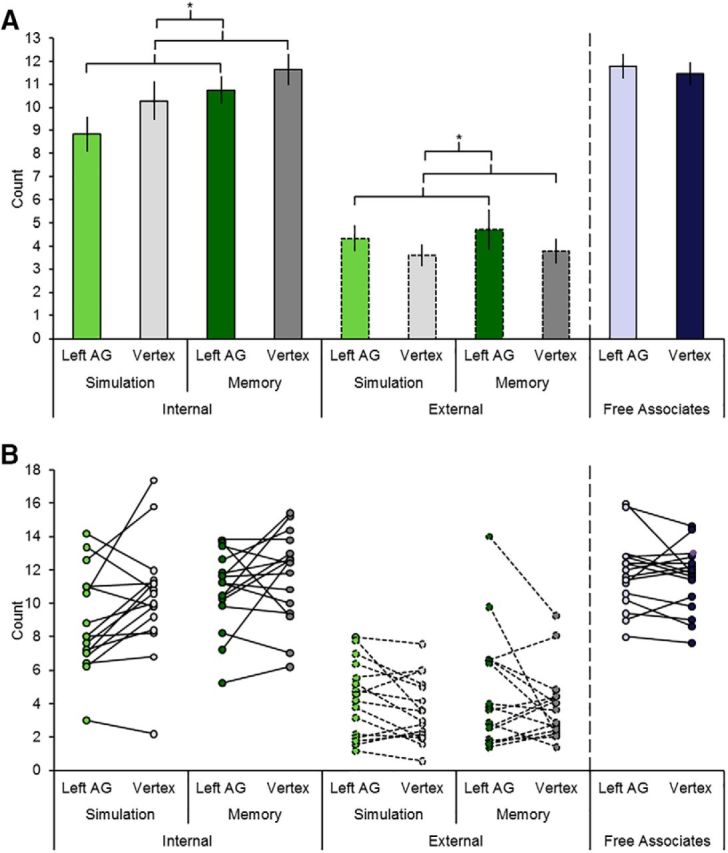
TMS results. A, Mean number of internal and external details for the simulation and memory tasks and the number of free associates produced with left angular gyrus TMS or vertex TMS. Error bars indicate mean ± SEM. Asterisks indicate significant results (see main text for details). B, Individual participant number of internal and external details for the simulation and memory tasks and number of free associates produced with left angular gyrus TMS or vertex TMS.