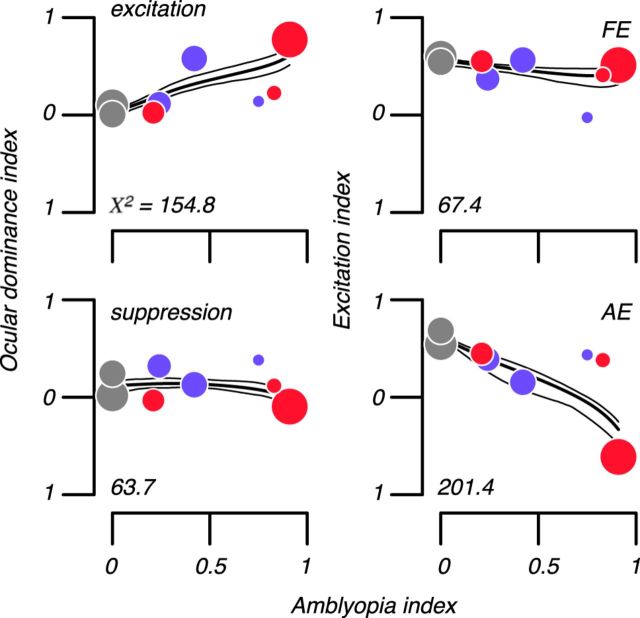
Figure 8.
Altered balance of excitation and suppression in binocular cortex. Top left scatterplot shows median ODI of binocular site excitation in our six amblyopes and two control subjects. Excitation in the FE dominated AE excitation in amounts associated with amblyopia severity (χ2 = 154.8; p ≪ 0.05), but the prevalence of suppression was largely unaffected by amblyopia (bottom, left). Top, right scatterplot shows median EI of binocular sites in six amblyopes' Fes and control subjects' LEs. Symbol size is proportional to number of binocular sites. Amblyopes' FEs were similar to control eyes in that excitation dominated suppression. However, in AEs, suppression dominated excitation (bottom right) in amounts associated with amblyopia severity (Kruskal–Wallis rank sum statistic, χ2 = 201.4; p ≪ 0.05). Solid lines show the best fitting model-free estimate of the dependence of each index on amblyopia severity (thin lines are 95% confidence intervals via bootstrap). Gray, blue, and red symbols show normal, anisometropic, and strabismic subjects, respectively.

