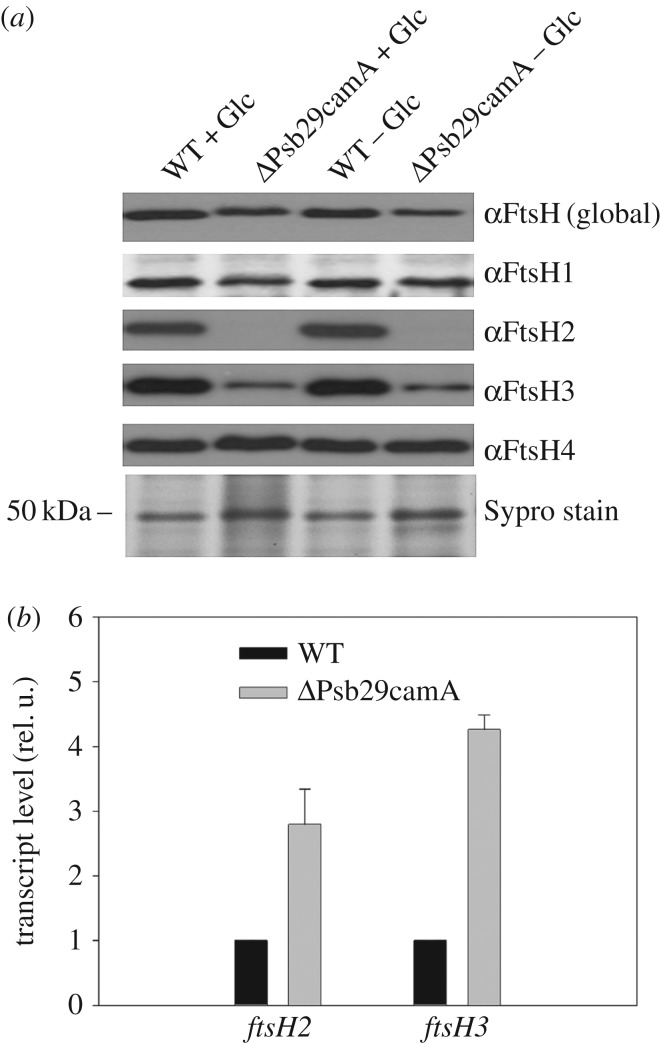
Figure 1.
(a) Immunochemical analysis of FtsH subunits in WT and ΔPsb29camA grown either in the presence (+Glc) or absence (−Glc) of glucose until an OD730 of 0.6–0.8. Protein loading assessed by protein staining (Sypro stain). (b) Relative transcript levels of ftsH2 and ftsH3 in WT and ΔPsb29camA determined by RT-PCR.

