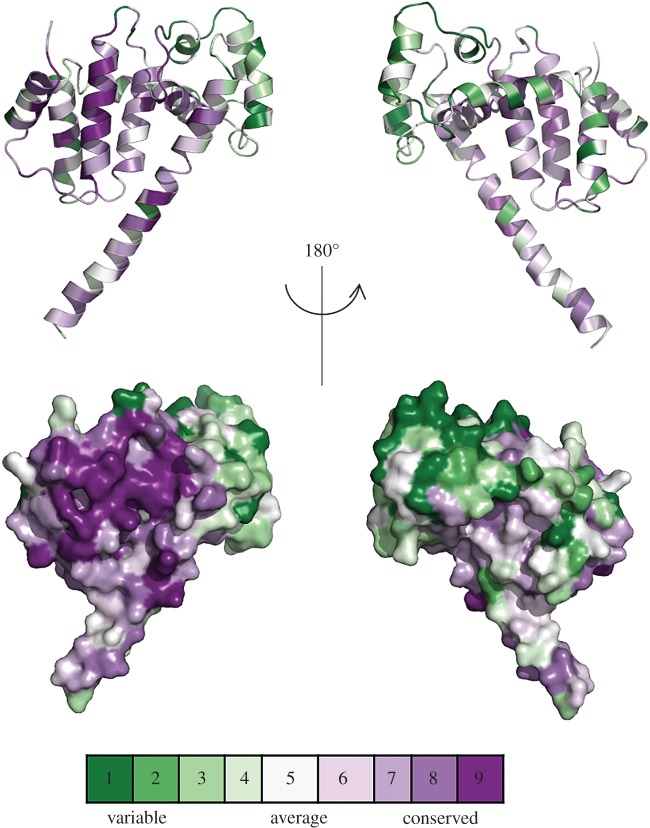
Figure 4.
Highly conserved residues in T. elongatus Psb29. A ConSurf analysis was performed based on the alignment of 211 Psb29/THF1 sequences from oxygenic phototrophs. The front and back views highlight the conserved and variable regions of Psb29 using the following colouring scheme: purple, 9 = maximal conservation; white, 5 = average conservation; green, 1 = maximal variability.

