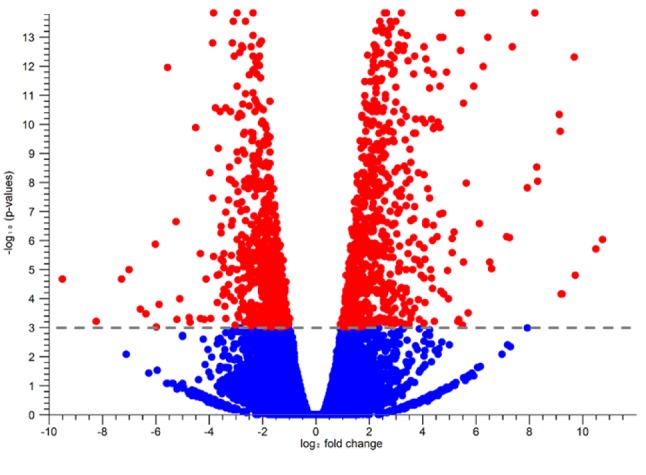
Figure 3. The volcano plot for statiscal comparison between VC (–)and VC (+). The log2 fold changes which were calculated based on VC (+)/VC (–) were plotted on the x-axis. The -log10 p-values are plotted on the yaxis. Dotted line was drawn on 0.001 FDR value. Each dot represents gene and statistically significant genes were red and others were blue.

