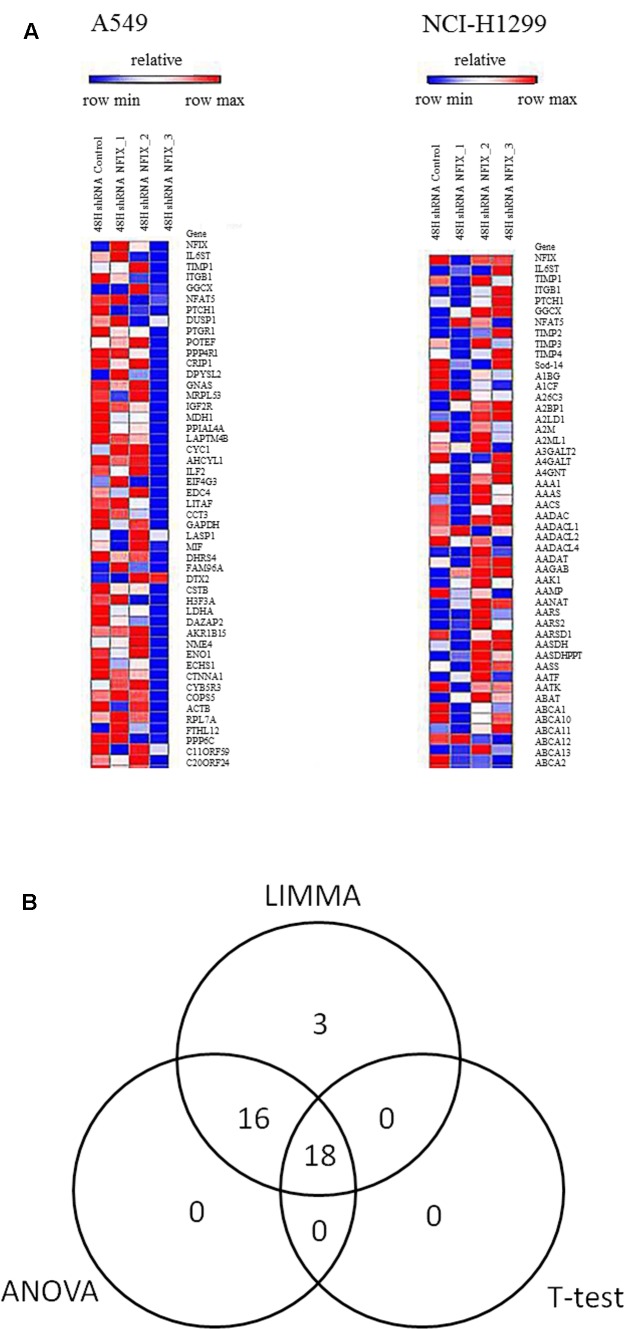
FIGURE 6.
Heatmap from microarray gene expression analyses showing the differentially expressed genes in the A549 and NCI-H1299cell lines. (A) Shows differentially expressed genes in both cell lines at48h post–NFIX shRNAs transfection as compared to the non-silenced samples. (B) T-test, LIMMA and ANOVA were used to identify differentially expressed genes between NFIX silencing and non-silencing in the A549 and NCI-H1299cell lines. In total, 18 genes were identified as differentially expressed between both cell lines (∗with Benjamini-Hochberg adjustment with p-value < 0.05).

